
جائزہ
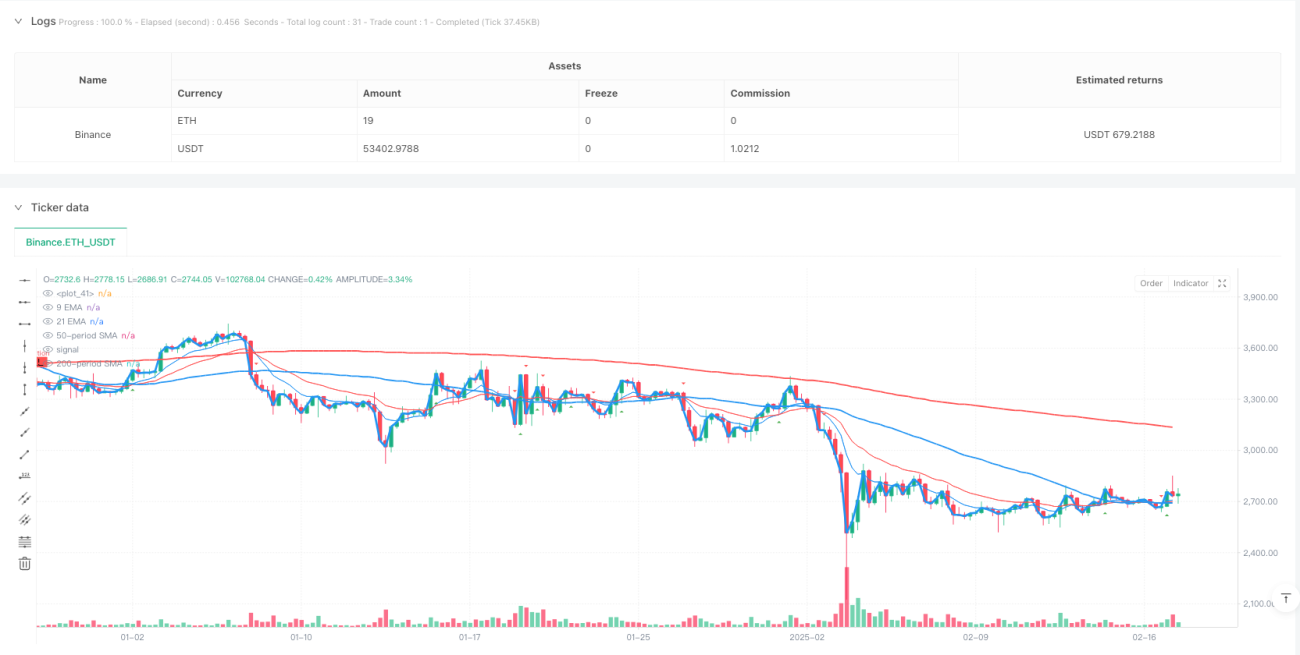
یہ حکمت عملی ایک ٹرینڈ ریورس ٹریڈنگ سسٹم ہے جو ایک سے زیادہ میڈین لائنز پر مبنی ہے ، جس میں 9 ، 21 ، 50 ، اور 200 دوروں کی متحرک اوسط شامل ہیں ، جس میں میڈین لائن کراسنگ سگنل کی نشاندہی کرکے مارکیٹ کے رجحانات کے موڑ کو پکڑنے کے لئے استعمال کیا جاتا ہے۔ حکمت عملی قلیل مدتی اور طویل مدتی میڈین لائنوں کے فوائد کو مربوط کرتی ہے ، جو مارکیٹ کی نقل و حرکت میں تبدیلی کو بروقت گرفت میں لے سکتی ہے اور غلط سگنل کو مؤثر طریقے سے فلٹر کرسکتی ہے۔
حکمت عملی کا اصول
حکمت عملی کی بنیادی منطق ایک سے زیادہ ٹائم فریموں کے مساوی لائن کراسنگ سسٹم پر مبنی ہے۔ خاص طور پر:
- اہم رجحانات کا تعین کرنے والے اشارے کے طور پر 50 ادوار اور 200 ادوار کی سادہ منتقل اوسط ((SMA) کا استعمال کرتے ہوئے
- مختصر مدت کے سگنل کی تصدیق کے طور پر 9 دور اور 21 دور کی اشاریہ منتقل اوسط ((EMA) کا استعمال کرتے ہوئے
- واپسی کی مدت اور دہلیز پیرامیٹرز کو ترتیب دے کر سگنل کے معیار کو بہتر بنائیں
- اہم قیمت کی حمایت اور مزاحمت کی سطح کے ساتھ مل کر ، اعداد و شمار کی بصیرت کے الگورتھم کے ذریعہ اہم قیمت کی سطح کی شناخت کرنا
جب قلیل مدتی اوسط لائن طویل مدتی اوسط لائن کو اوپر کی طرف سے پار کرتی ہے تو ، نظام ایک کثیر سگنل جاری کرتا ہے۔ اس کے برعکس ، ایک خالی سگنل جاری ہوتا ہے۔
اسٹریٹجک فوائد
- سگنلنگ سسٹم کی وشوسنییتا: ایک سے زیادہ اوسط لائنوں کی کراس تصدیق کے ذریعے ، جعلی سگنل کے خطرے کو نمایاں طور پر کم کیا گیا
- رجحانات کو سمجھنے کے لئے وقت کی اہمیت: مختصر مدت کی اوسط لائنوں کو متعارف کرانے سے حکمت عملی کو مارکیٹ میں تبدیلیوں پر تیزی سے ردعمل دینے میں مدد ملتی ہے
- خطرے کے کنٹرول کی جامعیت: حمایت اور مزاحمت کی پوزیشن کی شناخت معقول طور پر سٹاپ نقصان کو روکنے کی پوزیشن میں مدد ملتی ہے
- پیرامیٹرز کو بہتر بنانے میں لچک: مختلف مارکیٹ کے حالات کے مطابق واپسی کی مدت اور قیمتوں میں کمی کے پیرامیٹرز کو ایڈجسٹ کیا جاسکتا ہے
- بصری اثرات کی بدیہی: نظام واضح گرافک انٹرفیس فراہم کرتا ہے جو ٹریڈنگ کے فیصلے میں مدد کرتا ہے
اسٹریٹجک رسک
- مارکیٹ میں ہلچل کا خطرہ: افقی صفائی کے مرحلے میں اکثر غلط سگنل پیدا ہوسکتے ہیں
- تاخیر کا خطرہ: حرکت پذیر اوسط بنیادی طور پر ایک تاخیر کا اشارہ ہے ، جس سے بہترین داخلے کا موقع ضائع ہوسکتا ہے
- پیرامیٹر کی حساسیت: مختلف پیرامیٹر کے امتزاج حکمت عملی کی کارکردگی میں بڑے فرق کا باعث بن سکتے ہیں۔
- مارکیٹ کے ماحول پر انحصار: حکمت عملی واضح رجحانات والے بازاروں میں بہتر کارکردگی کا مظاہرہ کرتی ہے ، اور شدید اتار چڑھاؤ کے دوران خراب کارکردگی کا مظاہرہ کرسکتی ہے
حکمت عملی کی اصلاح کی سمت
- ان پٹ توانائی کے اشارے: سگنل کی تصدیق کے معاون اشارے کے طور پر ٹرانزیکشن کی مقدار پر غور کریں
- سگنل فلٹرنگ کو بہتر بنائیں: سگنل کی تصدیق کے زیادہ سخت طریقہ کار کو ڈیزائن کریں ، جیسے سگنل کو کچھ وقت تک جاری رکھنا
- متحرک پیرامیٹر ایڈجسٹمنٹ: مارکیٹ کی حالت کے مطابق پیرامیٹرز کو خود بخود ایڈجسٹ کرنے کے لئے ایک انکولی پیرامیٹر سسٹم تیار کیا گیا ہے
- بہتر خطرے کا کنٹرول: متحرک نقصانات کو روکنے اور منافع کو بچانے کے لئے
- مارکیٹ کے حالات کا فیصلہ شامل کریں: مختلف مارکیٹ کے حالات میں مختلف پیرامیٹرز کی ترتیبات کے ساتھ اتار چڑھاؤ کی شرح کے اشارے کے ساتھ
خلاصہ کریں۔
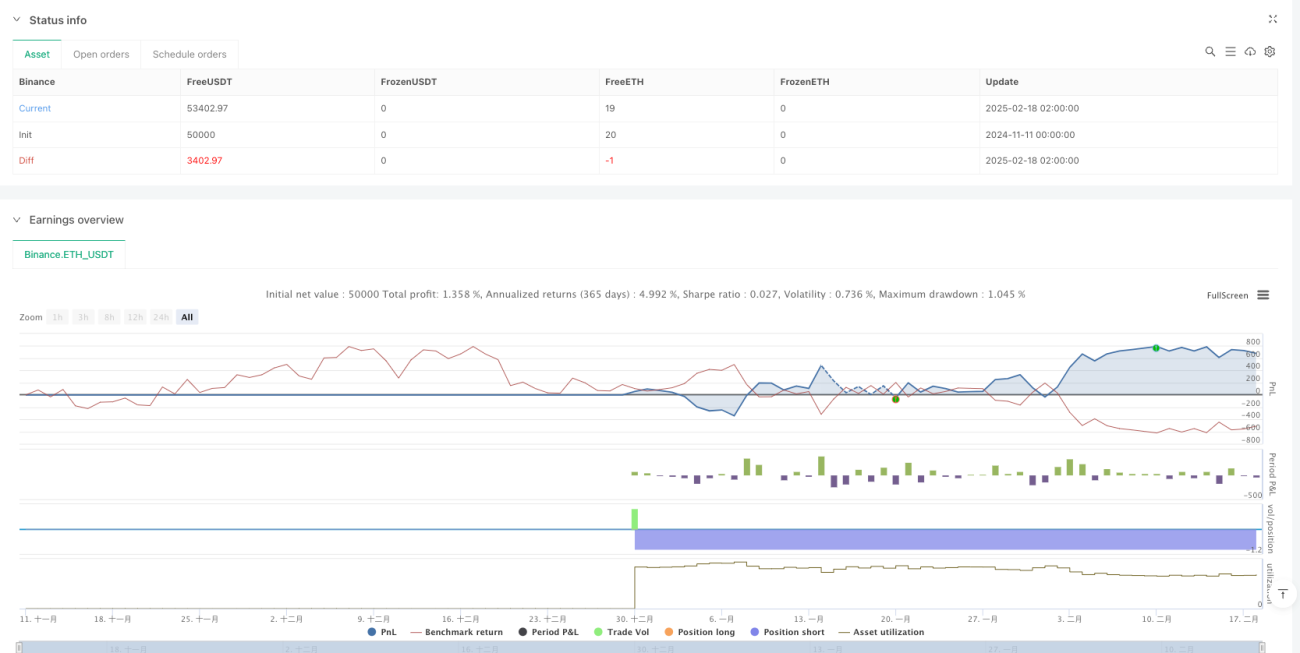
اس حکمت عملی میں ایک سے زیادہ مساوی نظام کے ہم آہنگی کے ذریعے مارکیٹ کے رجحانات کے موڑ کے نقطہ کی موثر شناخت کی جاسکتی ہے۔ حکمت عملی کے ڈیزائن میں عملی اور قابل عمل ہونے پر توجہ دی گئی ہے ، پیرامیٹرز کو مختلف مارکیٹ کے ماحول میں لچکدار موافقت کے ذریعے ڈھال لیا جاسکتا ہے۔ اگرچہ اس میں کچھ حدود موجود ہیں ، لیکن اس حکمت عملی کی مجموعی کارکردگی میں بہتر ترقی کی صلاحیت موجود ہے۔
- 1