
جائزہ
یہ حکمت عملی ایک تجارتی نظام ہے جس میں دوہری مساوی لائن کراس سگنل اور متحرک رسک مینجمنٹ کا امتزاج ہے۔ مختصر اور طویل مدتی منتقل اوسط کی کراسنگ کے ذریعہ تجارتی سگنل تیار کیا جاتا ہے ، جبکہ اے ٹی آر اشارے کا استعمال کرتے ہوئے اسٹاپ نقصان اور فائدہ اٹھانے کی پوزیشن کو متحرک طور پر ایڈجسٹ کیا جاتا ہے ، اور وقت کے فلٹرنگ اور ٹھنڈک کی مدت کو تجارت کے معیار کو بہتر بنانے کے لئے متعارف کرایا جاتا ہے۔ اس حکمت عملی میں رسک ریٹرن اور فی تجارت کے خطرے کی فیصد کا انتظام بھی شامل ہے۔
حکمت عملی کا اصول
حکمت عملی مندرجہ ذیل بنیادی اجزاء پر مبنی ہے:
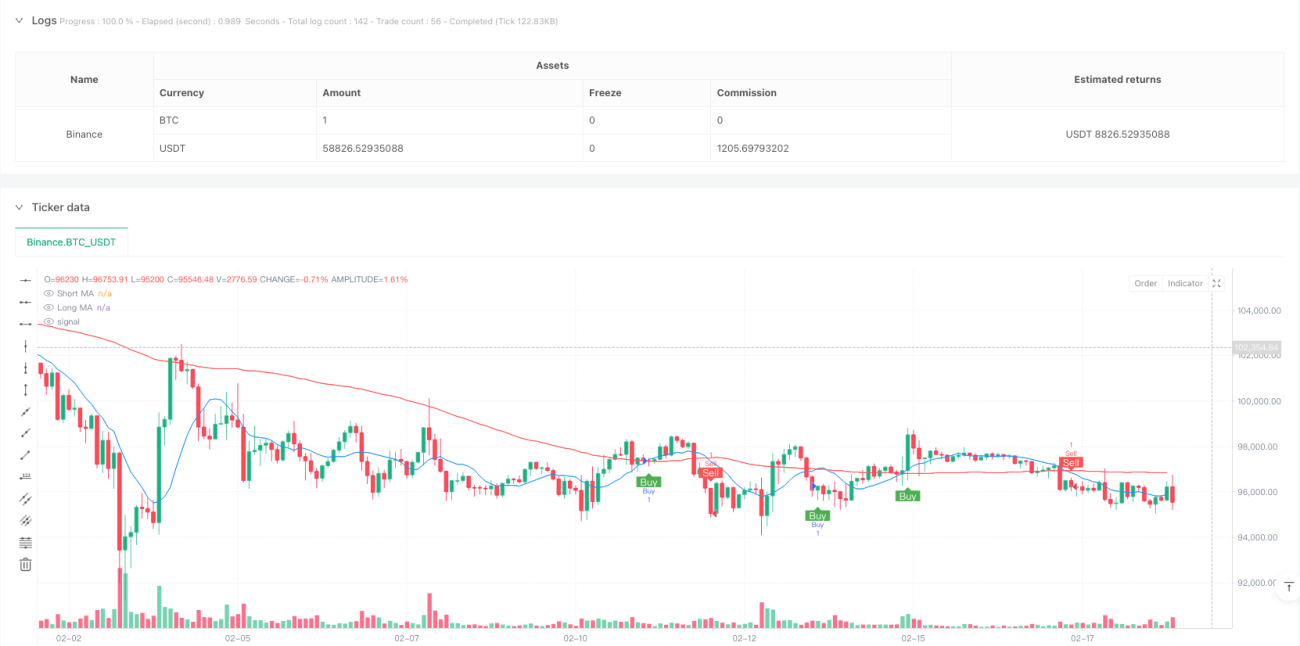
- سگنل جنریٹنگ سسٹم قلیل مدتی ((10 دورانیہ) اور طویل مدتی ((100 دورانیہ) سادہ منتقل اوسط کی کراسنگ کا استعمال کرتے ہوئے تجارت کو متحرک کرتا ہے۔ جب قلیل مدتی اوسط لائن طویل مدتی اوسط لائن کو اوپر کی طرف سے پار کرتی ہے تو ایک کثیر سگنل پیدا ہوتا ہے ، اور اس کے برعکس ، ایک کم سگنل پیدا ہوتا ہے۔
- رسک مینجمنٹ سسٹم نے 14 سائیکل اے ٹی آر کو 1.5 گنا فیکٹر کے ذریعہ متحرک اسٹاپ نقصان کا فاصلہ طے کیا ، جبکہ منافع کا ہدف 2 گنا اسٹاپ نقصان کا فاصلہ ہے (ایڈجسٹ رسک کمائی کا تناسب) ۔
- ٹائم فلٹر صارف کو ٹرانزیکشن کا ایک مخصوص وقت مقرر کرنے کی اجازت دیتا ہے، صرف مخصوص وقت کی حد کے اندر اندر ٹرانزیکشنز کو انجام دینے کے لئے.
- ٹرانزیکشن کولنگ میکانزم 10 سائیکلوں کے انتظار کا وقت مقرر کرتا ہے تاکہ زیادہ تجارت کو روکا جا سکے۔
- ہر ٹرانزیکشن کے لئے خطرہ اکاؤنٹ کے 1٪ پر کنٹرول کیا جاتا ہے (مستحکم) <unk>
اسٹریٹجک فوائد
- متحرک رسک مینجمنٹ: اے ٹی آر اشارے کا استعمال کرتے ہوئے مارکیٹ میں اتار چڑھاؤ کے مطابق ڈھالیں ، مختلف مارکیٹ کے حالات میں خود بخود اسٹاپ نقصان اور منافع کے فاصلے کو ایڈجسٹ کریں۔
- مکمل خطرے کا کنٹرول: خطرے کے منافع کا تناسب اور ہر تجارت کے خطرے کا تناسب مقرر کرکے ، رقم کے منظم انتظام کو حاصل کریں۔
- لچکدار ٹائم مینجمنٹ: مختلف مارکیٹوں میں ٹریڈنگ کے اوقات کی خصوصیات کے مطابق ٹریڈنگ کے اوقات کو ایڈجسٹ کیا جاسکتا ہے۔
- زیادہ تجارت سے بچاؤ: ٹھنڈک مدت کا طریقہ کار شدید اتار چڑھاؤ کے اوقات میں زیادہ تجارت کے اشارے پیدا کرنے سے بچنے کے لئے موثر ہے۔
- بصری اثرات: تجزیہ اور اصلاح کے لئے تجارتی سگنل اور منتقل اوسط کو چارٹ پر واضح طور پر دکھائیں۔
اسٹریٹجک رسک
- رجحان کے الٹ جانے کا خطرہ: ایک جھٹکے والی مارکیٹ میں جھوٹے بریک سگنل پیدا ہوسکتے ہیں ، جس کی وجہ سے مسلسل نقصان ہوتا ہے۔
- پیرامیٹرز کی حساسیت: متحرک اوسط کی مدت ، اے ٹی آر ضارب اور دیگر پیرامیٹرز کے انتخاب سے حکمت عملی کی کارکردگی پر نمایاں اثر پڑتا ہے۔
- ٹائم فلٹر کو غلط طریقے سے ترتیب دینے سے آپ اہم تجارتی مواقع سے محروم ہوسکتے ہیں۔
- فکسڈ رسک / کمائی کا تناسب مختلف مارکیٹ کے حالات میں کافی لچکدار نہیں ہوسکتا ہے۔
حکمت عملی کی اصلاح کی سمت
- رجحان کی طاقت کا فلٹر متعارف کرایا: رجحان کی طاقت کا فیصلہ کرنے کے لئے ADX یا اسی طرح کے اشارے شامل کیے جاسکتے ہیں ، صرف مضبوط رجحان کے دوران تجارت کریں۔
- متحرک طور پر ایڈجسٹ رسک کمائی تناسب: مارکیٹ میں اتار چڑھاؤ یا رجحان کی طاقت کے مطابق خود بخود ایڈجسٹ رسک کمائی تناسب۔
- ٹرانزیکشن حجم میں اضافہ: ٹرانزیکشن حجم کو سگنل کی تصدیق کے لئے ایک اضافی اشارے کے طور پر استعمال کریں.
- ٹھنڈک کی مدت کو بہتر بنانے کا طریقہ کار: ٹھنڈک کی مدت کی لمبائی کو مارکیٹ کے اتار چڑھاؤ کی رفتار کے مطابق ایڈجسٹ کریں۔
- مارکیٹ کے ماحول کی درجہ بندی میں شامل کریں: مختلف مارکیٹ کے ماحول میں مختلف پیرامیٹرز کا مجموعہ استعمال کریں۔
خلاصہ کریں۔
اس حکمت عملی میں کلاسیکی تکنیکی تجزیہ کے طریقوں اور جدید رسک مینجمنٹ کے تصورات کو ملا کر ایک مکمل ٹریڈنگ سسٹم بنایا گیا ہے۔ اس کے بنیادی فوائد متحرک رسک مینجمنٹ اور ایک سے زیادہ فلٹرنگ میکانزم پر مبنی ہیں ، لیکن پھر بھی عملی استعمال میں مارکیٹ کی مخصوص خصوصیات کے مطابق پیرامیٹرز کو بہتر بنانے کی ضرورت ہے۔ اس حکمت عملی کے کامیاب آپریشن کے لئے تاجروں کو ہر اجزاء کے کردار کی گہرائی سے تفہیم کی ضرورت ہوتی ہے ، اور مارکیٹ میں تبدیلی کے مطابق پیرامیٹرز کو بروقت ایڈجسٹ کریں۔ تجویز کردہ اصلاحی سمت کے ذریعہ ، اس حکمت عملی کو مختلف مارکیٹ کے ماحول میں زیادہ مستحکم کارکردگی کا امکان ہے۔
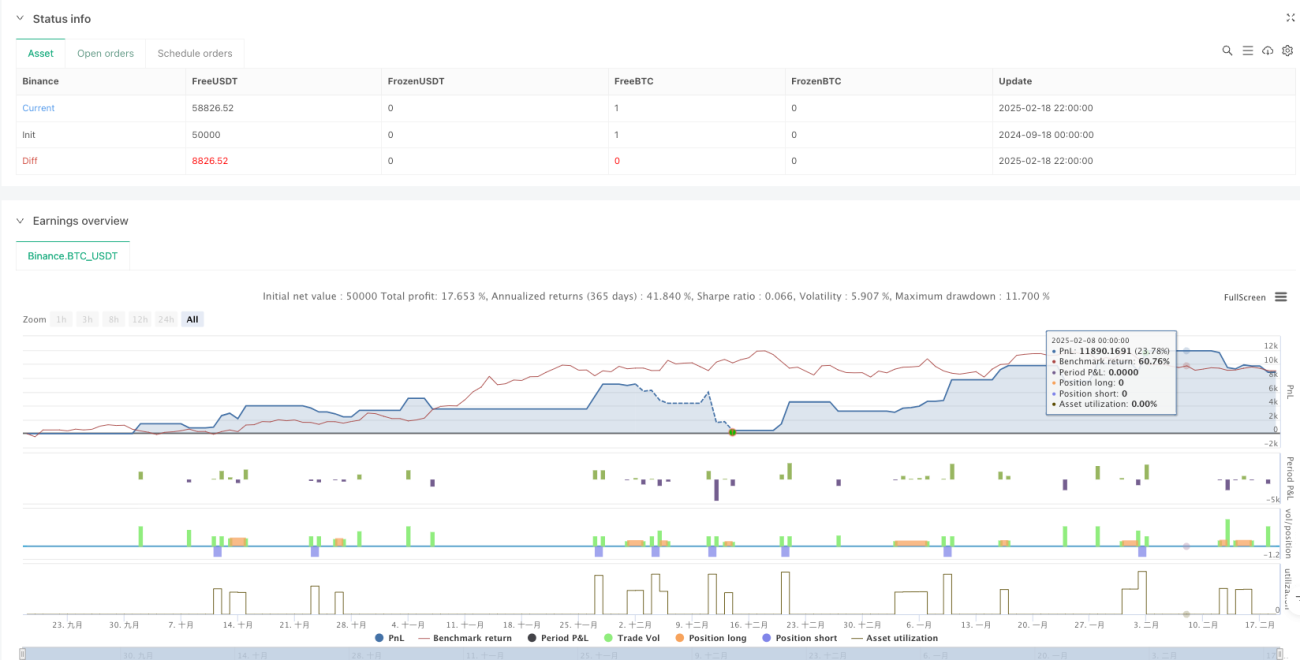
/*backtest
start: 2024-09-18 00:00:00
end: 2025-02-19 00:00:00
period: 2h
basePeriod: 2h
exchanges: [{"eid":"Binance","currency":"BTC_USDT"}]
*/

//@version=5
strategy("Profitable Moving Average Crossover Strategy", shorttitle="Profitable MA Crossover", overlay=true)

// Input parameters for the moving averages- 1