سپر ٹرینڈ اینگولفنگ پیٹرن ڈائنامک رسک کنٹرول اسٹریٹجی

جائزہ
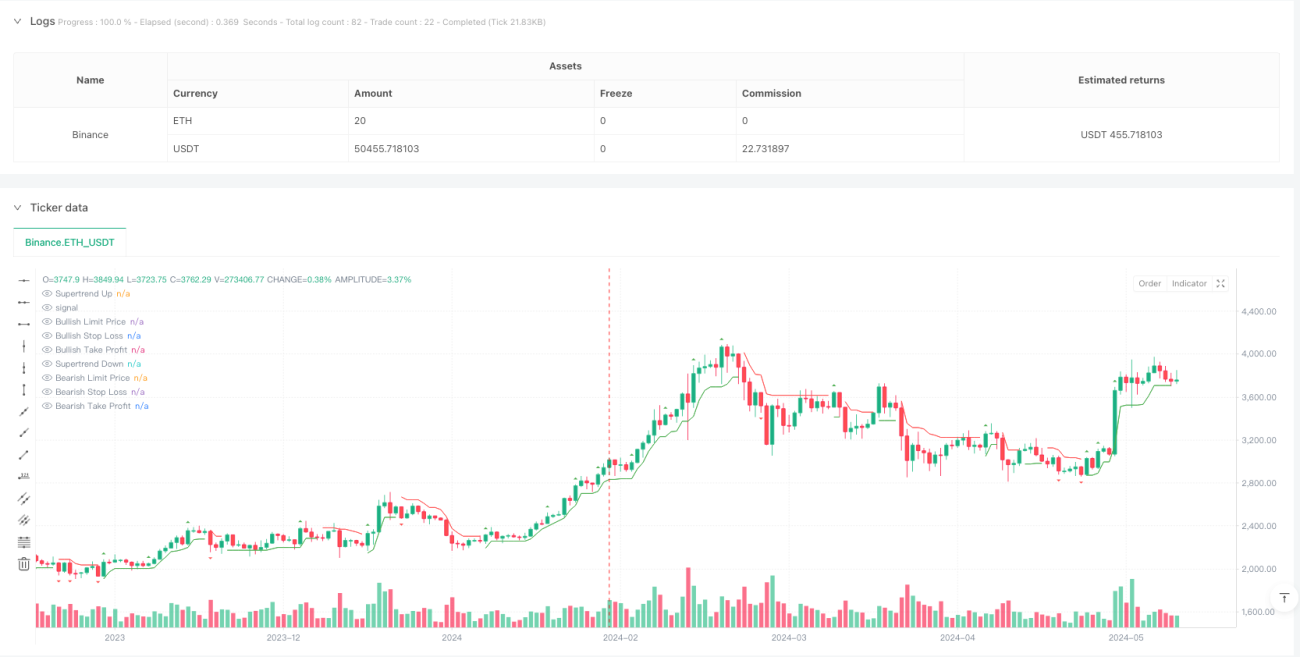
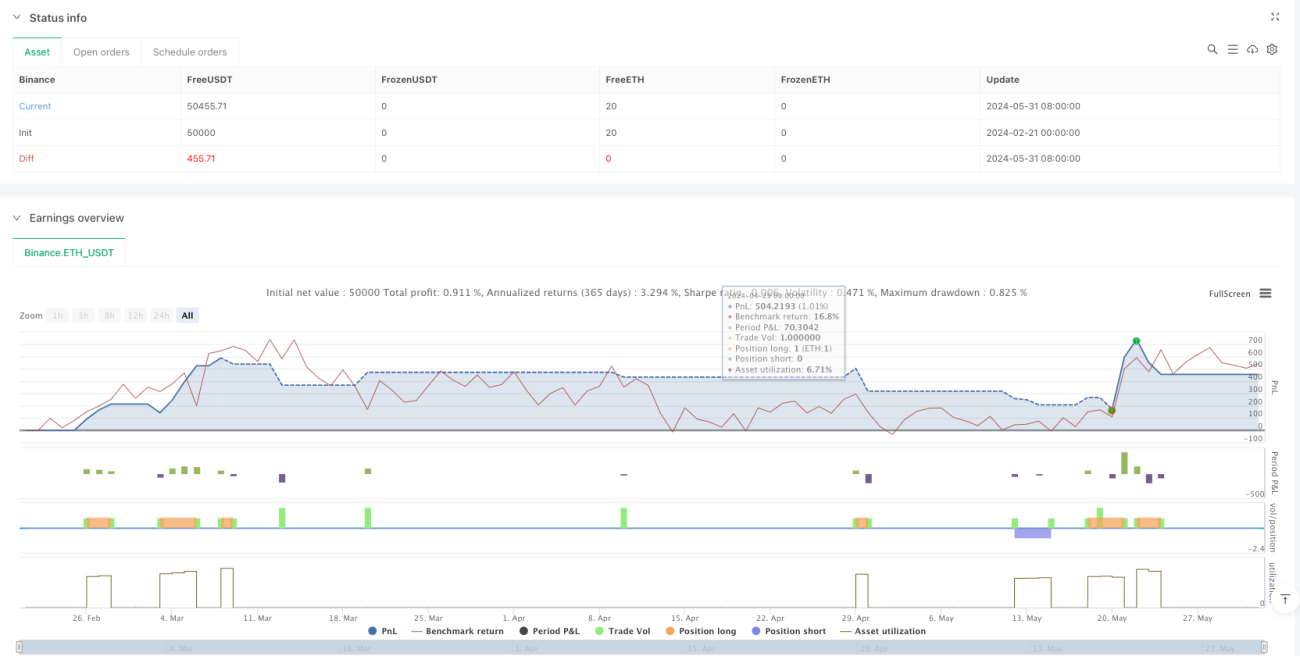
یہ ایک اعلی درجے کی تجارتی حکمت عملی ہے جو سپر ٹرینڈ اشارے اور نگلنے والی شکلوں کو جوڑتی ہے۔ حکمت عملی مارکیٹ میں نگلنے والی شکلوں کے نقشے کے نمونوں کی نشاندہی کرتی ہے ، اور سپر ٹرینڈ اشارے کے ساتھ مل کر رجحان کی سمت کی تصدیق کرتی ہے ، جس سے ٹریڈنگ سگنل کا درست فلٹرنگ ممکن ہوتا ہے۔ اس حکمت عملی میں متحرک اسٹاپ نقصان اور منافع کی ترتیب بھی شامل ہے ، جو خطرے کو مؤثر طریقے سے کنٹرول کرتی ہے جبکہ منافع کو یقینی بناتی ہے۔
حکمت عملی کا اصول
حکمت عملی بنیادی طور پر مندرجہ ذیل بنیادی اصولوں پر مبنی ہے:
- سپر ٹرینڈ اشارے کا حساب لگانے کے لئے اے ٹی آر کا استعمال کیا جاتا ہے ، جو مجموعی طور پر مارکیٹ کے رجحانات کا تعین کرنے کے لئے استعمال ہوتا ہے۔
- Boring Candle Threshold اور Engulfing Candle Threshold کو ترتیب دے کر موثر نگلنے کی شکل کو فلٹر کریں۔
- سپر ٹرینڈ رجحان کی سمت اور نگلنے کی شکل کی سمت سے ملنے پر ہی پوزیشن کھولیں۔
- متحرک سٹاپ نقصان اور فائدہ اٹھانے کی پوزیشن کا استعمال کرتے ہوئے، پوزیشن کھولنے کی قیمت پر مبنی تناسب سے حساب لگایا گیا تھا.
- اسٹریٹجک پوزیشن مینجمنٹ کا استعمال کرتے ہوئے ، اس بات کو یقینی بنائیں کہ ایک ہی وقت میں صرف ایک ہی تجارت کی سمت ہو۔
اسٹریٹجک فوائد
- سگنل کوالٹی کنٹرول سخت ہے، دوہری تصدیق ((رجحان + موڈ) کی طرف سے درستگی میں اضافہ.
- بورنگ اور نگلنے کی حد کے تصورات کو متعارف کرایا گیا ہے، جو جعلی سگنل کو مؤثر طریقے سے فلٹر کرتا ہے.
- اے ٹی آر پر مبنی متحرک سپر ٹرینڈ حساب کتاب ، حکمت عملی کو اچھی مارکیٹ موافقت فراہم کرتی ہے۔
- بہتر سٹاپ نقصان اور منافع کے انتظام کے نظام، خطرے کو کنٹرول کرنے اور منافع کو لاک کرنے کے لئے.
- اس کے علاوہ ، اس میں ٹریڈنگ سگنل ، اسٹاپ نقصان اور منافع کے اہداف کو واضح طور پر دیکھا جاسکتا ہے۔
اسٹریٹجک رسک
- اس کے علاوہ ، مارکیٹ میں ہلچل کے دوران اکثر جھوٹے بریک سگنل پیدا ہوسکتے ہیں۔
- فکسڈ سٹاپ نقصان اور منافع کی ترتیب تمام مارکیٹ کے حالات کے لئے موزوں نہیں ہو سکتا.
- ٹرینڈ کی تبدیلی کے بعد بڑے پیمانے پر واپسی کا امکان ہے۔
- پیرامیٹرز کی ترتیب حساس ہے، غلط پیرامیٹرز پالیسی کی خراب کارکردگی کا سبب بن سکتا ہے.
- کم لیکویڈیٹی والے بازاروں میں ، آپ کو سلائڈ پوائنٹ کا خطرہ لاحق ہوسکتا ہے۔
حکمت عملی کی اصلاح کی سمت
- سگنل کی تصدیق کے طور پر ٹرانسمیشن کی پیمائش متعارف کرایا جا سکتا ہے.
- متحرک اے ٹی آر ضارب ریگولیٹری میکانزم کو شامل کرنے پر غور کریں۔
- اسٹاپ نقصان اور منافع کا تناسب مارکیٹ میں اتار چڑھاو کی بنیاد پر متحرک طور پر ایڈجسٹ کیا جاتا ہے۔
- وقت کے فلٹرز کو شامل کریں تاکہ غیر مناسب وقت کے دوران تجارت سے بچا جاسکے۔
- ٹریڈنگ کے معیار کو بہتر بنانے کے لئے رجحان کی طاقت کے فلٹر کو شامل کرنے پر غور کریں.
خلاصہ کریں۔
یہ ایک سخت ڈیزائن ، منطقی طور پر واضح حکمت عملی ہے ، جو تکنیکی اشارے اور شکل تجزیہ کے ساتھ مل کر سگنل کے بہتر معیار کو کنٹرول کرتی ہے۔ حکمت عملی کے خطرے کے انتظام کے طریقہ کار کو بہتر بنایا گیا ہے ، بصری اثرات بہترین ہیں ، جو عملی طور پر جانچ اور اصلاح کے لئے موزوں ہیں۔ یہ تجویز کیا گیا ہے کہ تاجر عملی استعمال میں پیرامیٹرز کی اصلاح اور مارکیٹ کے ماحول کے انتخاب پر توجہ دیں۔
- 1