متحرک EMA کراس اوور سوئنگ ہائی لو ایڈپٹیو حکمت عملی

جائزہ
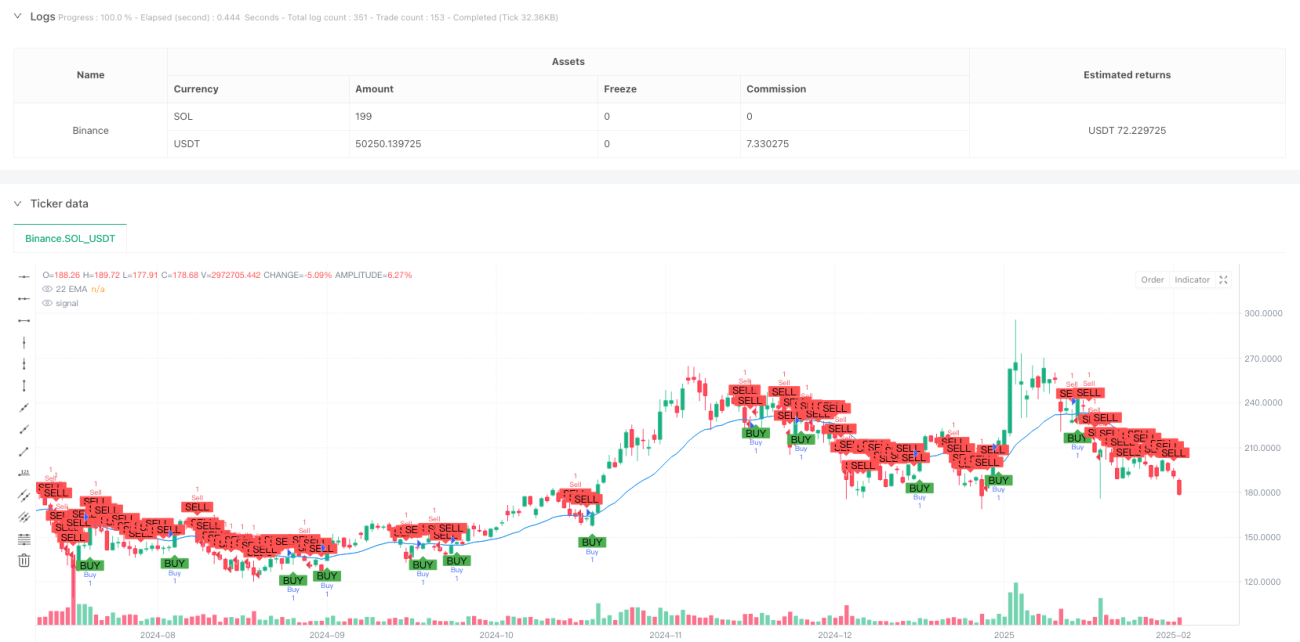
یہ حکمت عملی ایک تجارتی نظام ہے جس میں 22 پیریڈ انڈیکس حرکت پذیر اوسط (ای ایم اے) کراس سگنل اور سوئنگ پوائنٹ پوزیشن پر مبنی ہے۔ یہ قیمتوں اور ای ایم اے کے کراس کے ذریعہ تجارتی سگنل تیار کرتا ہے اور اسٹاپ نقصان کی پوزیشن کو ایڈجسٹ سوئنگ بلندیوں اور کم سے استعمال کرتا ہے۔ اس طریقہ کار سے رجحانات کی پیروی کرنے کی بنیادی صلاحیت کو یقینی بنایا جاتا ہے اور خطرے کے انتظام میں لچک کو بڑھایا جاتا ہے۔
حکمت عملی کا اصول
حکمت عملی کی بنیادی منطق میں درج ذیل کلیدی عناصر شامل ہیں:
- 22 سائیکل ای ایم اے کا استعمال کرتے ہوئے ایک اہم رجحان اشارے کے طور پر ، یہ سائیکل مارکیٹ کے شور کو بہتر طور پر فلٹر کرتا ہے
- جب بند ہونے والی قیمت ای ایم اے کے اوپر سے گزرتی ہے تو ایک سے زیادہ سگنل ٹرگر ہوجاتا ہے ، جب نیچے سے گزرتی ہے تو ایک خالی سگنل ٹرگر ہوجاتا ہے
- 14 سائیکلوں کے تاریخی اعداد و شمار کے ذریعے ہلچل کے اعلی اور کم
- زیادہ تجارت کریں اور اپنے اسٹاپ نقصان کے طور پر اپنے حالیہ ہلچل کی اونچائی کو نشانہ بنائیں۔
- ٹریڈنگ کے دوران ، اسٹاپ ٹریڈنگ کا مقصد کم سے کم حالیہ اتار چڑھاؤ کو روکنا ہے ، اور زیادہ سے زیادہ اتار چڑھاؤ کو روکنا ہے
اسٹریٹجک فوائد
- رجحانات کے ساتھ مطابقت پذیر: 22 سائیکل ای ایم اے وسط مدتی رجحانات کو مؤثر طریقے سے پکڑنے کے قابل ہیں ، جس سے زیادہ بار بار تجارت سے بچا جاسکتا ہے
- متحرک رسک مینجمنٹ: اسٹاپ اسٹاپ پوائنٹس مارکیٹ میں اتار چڑھاو کے مطابق خود بخود ایڈجسٹ ہوجاتے ہیں ، حکمت عملی کی موافقت کو بہتر بناتے ہیں
- واضح طور پر عملدرآمد: ٹریڈنگ سگنل واضح ہیں، فیصلے کے لئے کوئی مبہم علاقہ نہیں ہے
- معقول منافع خطرہ تناسب: پوائنٹ کی ترتیب کو روکنے اور روکنے کی طرف سے، ہر تجارت کے لئے منافع خطرہ تناسب نسبتا مستحکم ہے
- اچھے بصری اثرات: حکمت عملی واضح بصری سگنل فراہم کرتی ہے جو تاجروں کو سمجھنے اور نگرانی میں آسان بناتی ہے
اسٹریٹجک رسک
- زلزلے کی مارکیٹ کا خطرہ: زلزلے کی مارکیٹوں میں اکثر جھوٹے بریک سگنل پیدا ہوسکتے ہیں
- سلائڈ پوائنٹ کا خطرہ: شدید اتار چڑھاؤ کے دوران ، اصل سودے کی قیمت سگنل کی قیمت سے زیادہ انحراف کا شکار ہوسکتی ہے
- اونچی اونچائی کا خطرہ: مارکیٹ میں اونچی اونچائی کا خطرہ اسٹاپ نقصان کی ناکامی کا سبب بن سکتا ہے ، جس سے غیر متوقع نقصان ہوتا ہے۔
- رجحان کا رخ موڑنے کا خطرہ: اہم رجحان موڑ کے قریب لگاتار نقصانات کا امکان
حکمت عملی کی اصلاح کی سمت
- ٹرانزیکشن حجم کے اشارے متعارف کروائے گئے: ٹرانزیکشن حجم کے ذریعہ سگنل کی وشوسنییتا کی تصدیق کی جاسکتی ہے
- ٹرینڈ فلٹرز شامل کریں: ایک طویل عرصے سے چلنے والی اوسط کے ساتھ مل کر ، مخالف رجحان کے اشارے کو فلٹر کریں
- اسٹاپ نقصان کو بہتر بنانے کا طریقہ: اے ٹی آر کو متحرک طور پر اسٹاپ نقصان کے فاصلے کو ایڈجسٹ کرنے پر غور کیا جاسکتا ہے
- وقت کا فلٹر شامل کریں: زیادہ اتار چڑھاؤ سے بچنے کے لئے مخصوص وقت کے دوران پوزیشن کھولنے پر پابندی لگائیں
- سگنل کی توثیق کے طریقہ کار کی ترقی: دیگر تکنیکی اشارے کے ساتھ مل کر سگنل کی توثیق کے طور پر ، جیت کی شرح میں اضافہ
خلاصہ کریں۔
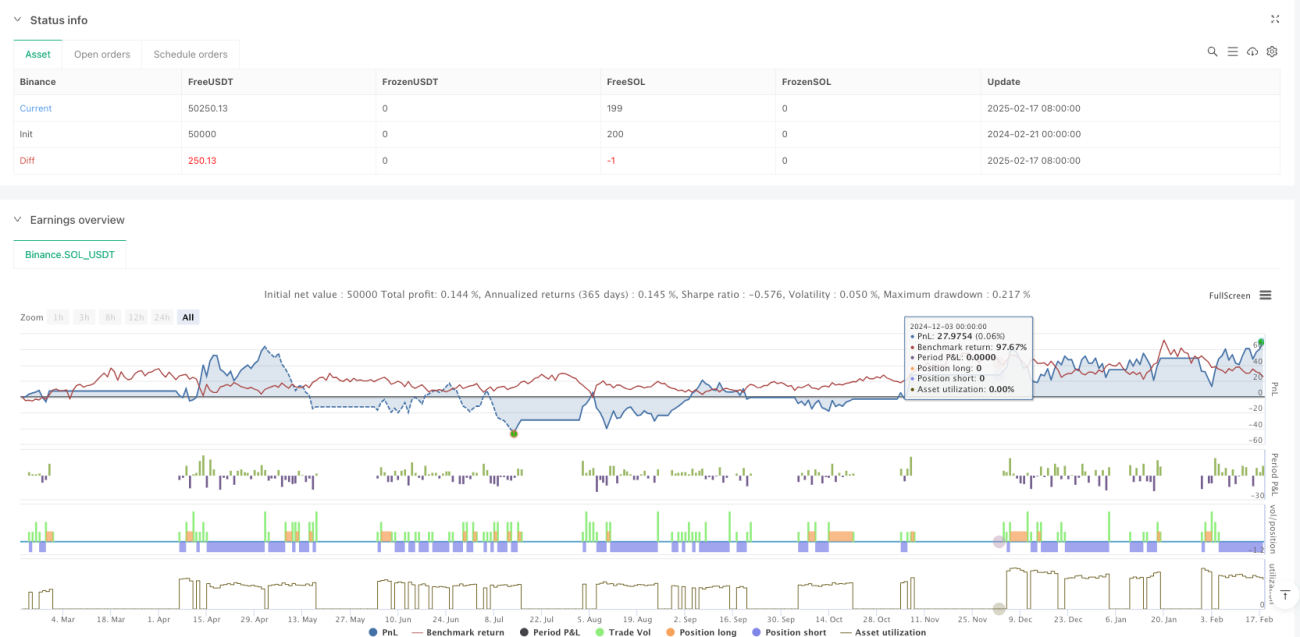
یہ ایک منظم ، منطقی طور پر واضح رجحان کی پیروی کرنے والی حکمت عملی ہے۔ ای ایم اے کراسنگ کے ذریعہ تجارتی سگنل پیدا کرنے کے لئے ، اسکیلپنگ پوائنٹس کے خطرے کے انتظام کا استعمال کرتے ہوئے ، ایک متوازن تجارتی نظام تشکیل دیا گیا ہے۔ حکمت عملی کا بنیادی فائدہ مارکیٹ میں متحرک طور پر ڈھالنے کی اس کی صلاحیت میں ہے ، جبکہ مارکیٹ کی حالت میں تبدیلی سے بنیادی خطرہ پیدا ہوتا ہے۔ تجویز کردہ اصلاحی سمت کے ذریعہ ، حکمت عملی کی استحکام اور منافع بخش صلاحیت کو مزید فروغ دینے کی امید ہے۔
- 1