ٹرپل بولنگر بینڈ اسٹینڈرڈ ڈیوی ایشن ٹرینڈ کے بعد حکمت عملی

جائزہ
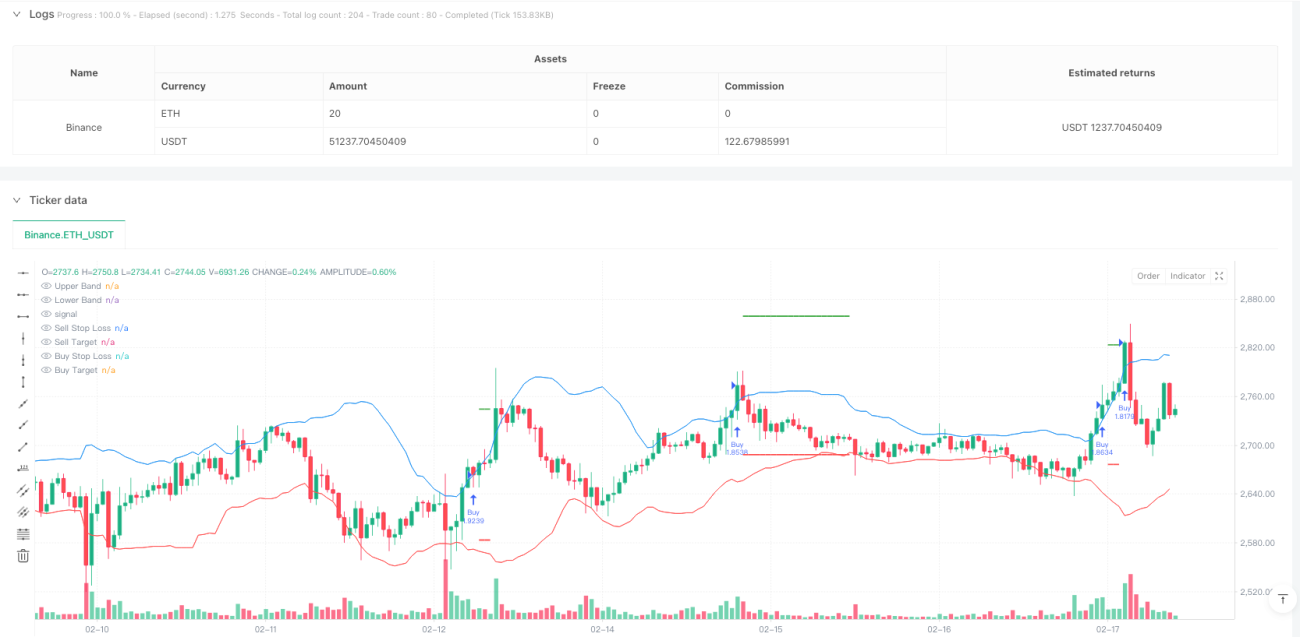
یہ حکمت عملی ایک ٹریڈنگ سسٹم ہے جو بروئنگ بینڈ کے معیاری فاصلے پر مبنی رجحانات کی پیروی کرتی ہے۔ حکمت عملی اس رجحان کی طاقت کا اندازہ لگانے کے لئے بروئنگ بینڈ کے نیچے والے مقام کے سلسلے میں تین مسلسل سلاخوں کا مشاہدہ کرتی ہے ، اور جب رجحان قائم ہوتا ہے تو تجارت کرتی ہے۔ اس نظام میں ہر تجارت کے خطرے کا انتظام کرنے کے لئے ایک مقررہ خطرہ منافع کا تناسب استعمال کیا جاتا ہے۔
حکمت عملی کا اصول
حکمت عملی کی بنیادی منطق درج ذیل نکات پر مبنی ہے:
- 20 دوروں کی حرکت پذیری اوسط کو برین بینڈ کے وسط ریل کے طور پر استعمال کریں اور 2 گنا معیاری فرق کو اوپر اور نیچے ریل پر حساب لگائیں۔
- جب لگاتار تین سلاخوں کی بندش کی قیمتیں اوپر کی طرف ہوتی ہیں تو ، نظام یہ سمجھتا ہے کہ اوپر کا رجحان قائم ہوچکا ہے ، اور جب تیسری سلاخیں بند ہوتی ہیں تو زیادہ سرمایہ کاری کی جاتی ہے۔
- جب لگاتار تین سلاخوں کی بندش کی قیمتیں نیچے کی طرف ہیں تو ، نظام کا خیال ہے کہ نیچے کی طرف رجحان قائم ہے ، اور تیسری سلاخوں کی بندش کے وقت انٹری خالی ہے۔
- سٹاپ نقصان داخلہ سگنل میں سب سے پہلے کی سلائیڈ کی زیادہ سے زیادہ قیمت پر مقرر کیا گیا تھا.
- ہدف کی قیمت کا تعین 1: 1 کے خطرے سے فائدہ اٹھانے کے تناسب کے ساتھ کیا جاتا ہے ، یعنی منافع بخش ہدف کا فاصلہ اسٹاپ نقصان کے فاصلے کے برابر ہے۔
اسٹریٹجک فوائد
- سگنل کی تصدیق کا طریقہ کار مضبوط ہے - برن بینڈ کو توڑنے کے لئے تین مسلسل تاروں کی ضرورت ہوتی ہے ، جس سے جعلی توڑنے کے خطرے کو مؤثر طریقے سے کم کیا جاتا ہے۔
- خطرے کا انتظام معقول ہے - فکسڈ خطرے کے منافع کے تناسب کا استعمال کرتے ہوئے تجارت کا انتظام کیا جاتا ہے ، جس سے ایک ہی تجارت میں زیادہ سے زیادہ نقصان سے بچا جاتا ہے۔
- رجحان سے باخبر رہنے کا اثر نمایاں ہے - برن بینڈ کی معیاری فاصلے کی خصوصیت حکمت عملی کو مارکیٹ میں اتار چڑھاؤ کی تبدیلیوں کے مطابق ڈھالنے کی اجازت دیتی ہے۔
- عملدرآمد کے قواعد واضح ہیں - داخلے ، اسٹاپ نقصان اور منافع کے اہداف کی ترتیب میں واضح مقداری معیار ہیں ، جس میں کسی بھی طرح کے موضوعی فیصلے کی ضرورت نہیں ہے۔
اسٹریٹجک رسک
- افقی مارکیٹوں کی ناقص کارکردگی - غیر واضح رجحان کے ساتھ مارکیٹوں میں اکثر غلط سگنل پیدا ہوسکتے ہیں۔
- داخلہ کے وقت میں تھوڑی تاخیر ہوئی ہے - داخلہ کے لئے تین ٹیلی فون کی تصدیق کا انتظار کرنا پڑتا ہے ، اور ہوسکتا ہے کہ آپ کچھ ابتدائی مراحل سے محروم ہوجائیں۔
- فکسڈ رسک کمائی تناسب کی حد - 1: 1 رسک کمائی تناسب مضبوط رجحانات میں بہت جلد منافع بخش حصے کو ختم کرسکتا ہے۔
- رجحان کی طاقت کی فلٹرنگ کا فقدان - صرف قیمتوں اور برین بینڈ کے تعلقات پر مبنی فیصلہ ، دوسرے رجحان کی تصدیق کے اشارے پر غور نہیں کیا گیا۔
حکمت عملی کی اصلاح کی سمت
- بڑھتی ہوئی رجحان کی طاقت فلٹر - سگنل کے معیار کو بہتر بنانے کے لئے رجحان اشارے جیسے ADX یا MACD متعارف کرایا جا سکتا ہے.
- زیادہ سے زیادہ رسک / کمائی کا تناسب ترتیب دیں - مارکیٹ میں اتار چڑھاؤ کی رفتار کے مطابق رسک / کمائی کا تناسب ایڈجسٹ کیا جاسکتا ہے۔
- اسٹاپ میکینزم کو بہتر بنائیں - بڑے رجحانات کو بہتر طور پر پکڑنے کے لئے موبائل اسٹاپ نقصان یا منافع کی تقسیم کو بڑھانے پر غور کریں۔
- ٹرانسمیشن کی تصدیق شامل کریں - سگنل کی پیداوار کے وقت ٹرانسمیشن کی توثیق کی توثیق میں اضافہ کریں ، سگنل کی وشوسنییتا کو بہتر بنائیں۔
خلاصہ کریں۔
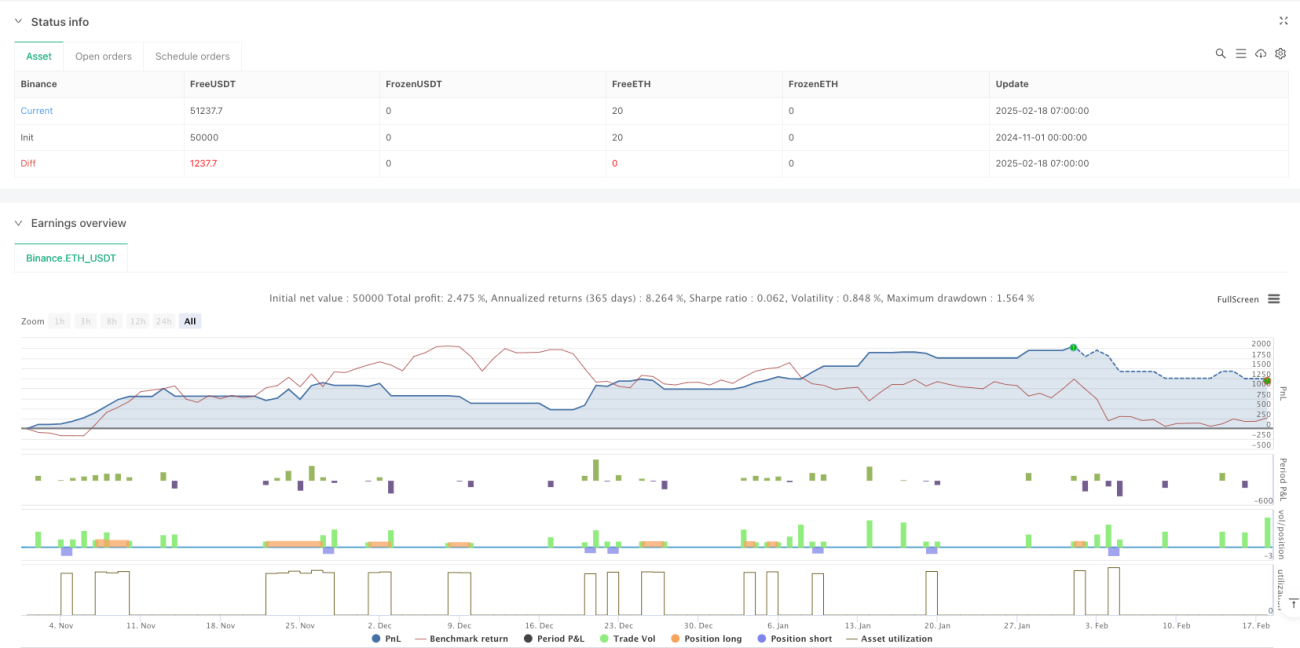
یہ ایک مناسب ڈیزائن کردہ رجحان سے باخبر رہنے کی حکمت عملی ہے ، جس میں مارکیٹ کے رجحانات کو برین بینڈ اور متعدد تصدیق کے طریقہ کار کے ذریعہ پکڑ لیا گیا ہے۔ حکمت عملی کا خطرہ مینجمنٹ فریم ورک کامل ہے ، معیارات پر عمل درآمد واضح ہے۔ اگرچہ کچھ پسماندگی موجود ہے ، لیکن تجویز کردہ اصلاح کی سمت سے حکمت عملی کی استحکام اور منافع کو مزید بہتر بنایا جاسکتا ہے۔ رجحان سے باخبر رہنے اور خطرے پر قابو پانے پر توجہ دینے والے تاجروں کے لئے ، یہ ایک قابل ذکر حکمت عملی کا فریم ورک ہے۔
/*backtest
start: 2024-11-01 00:00:00
end: 2025-02-18 08:00:00
period: 1h
basePeriod: 1h
exchanges: [{"eid":"Binance","currency":"ETH_USDT"}]
*/

//@version=6
strategy("Bollinger Band Buy and Sell Strategy (Entry at Close of 3rd Candle)", overlay=true, default_qty_type=strategy.percent_of_equity, default_qty_value=10, pyramiding=0)

// Bollinger Band settings- 1