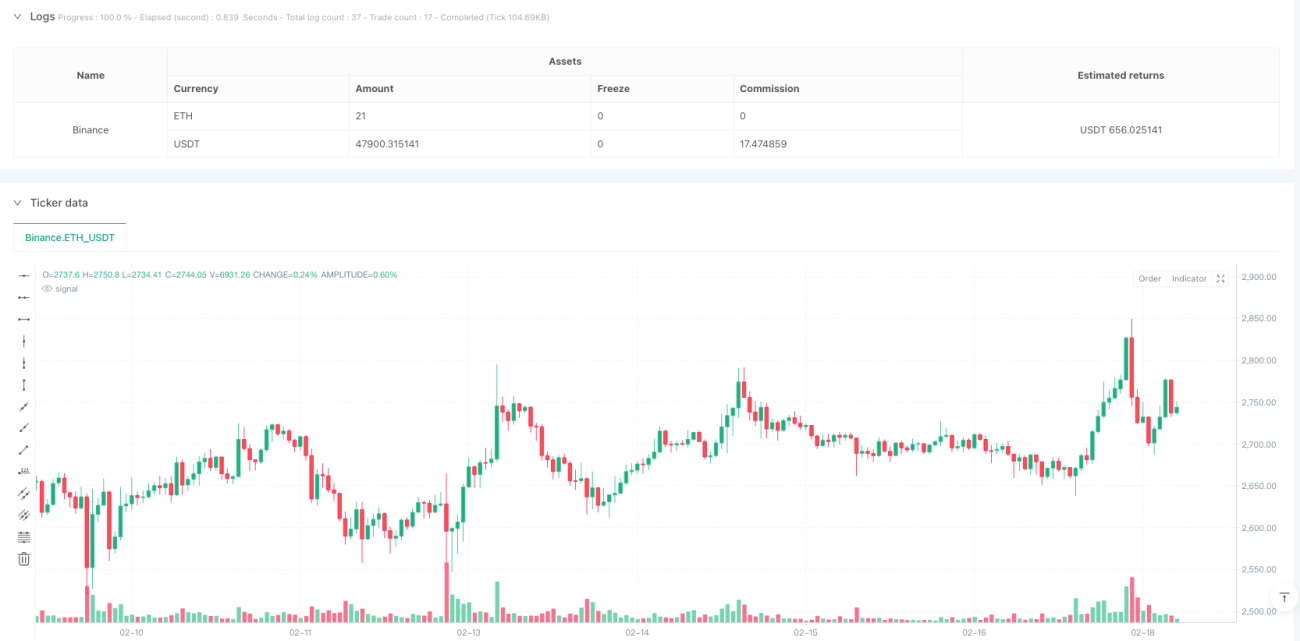
ملٹی انڈیکیٹر باہمی تجارتی سگنل جنریشن کی حکمت عملی (RSI-BB-IMI-MFI)

جائزہ
یہ حکمت عملی ایک تجارتی سگنل جنریٹر سسٹم ہے جو متعدد تکنیکی اشارے کے ہم آہنگی تجزیہ پر مبنی ہے۔ حکمت عملی چار کلاسیکی تکنیکی اشارے ، رشتہ دار طاقت اور کمزوری کا اشارے (RSI) ، برلن بینڈ (BB) ، دن کی نقل و حرکت کا اشارے (IMI) اور کیش فلو انڈیکس (MFI) کو مربوط کرتی ہے ، تاکہ اشارے کے مابین کراس توثیق کے ذریعہ زیادہ قابل اعتماد تجارت پیدا کی جاسکے۔ سگنل حکمت عملی کو ڈیزائن کیا گیا ہے خاص طور پر 4 گھنٹے کی مدت کے لئے موزوں ہے ، اور سگنل کی طاقت کے مطابق دو درجوں میں باقاعدہ سگنل اور مضبوط سگنل میں تقسیم ہے۔
حکمت عملی کا اصول
اس حکمت عملی کا بنیادی منطق یہ ہے کہ تجارتی سگنل کو متعدد اشارے کے تعاون سے تصدیق کی جائے۔ خاص طور پر:
- خریدنے کے لئے سگنل کی شرائط:
- RSI 30 سے نیچے ، جو مارکیٹ کو زیادہ فروخت کرنے کی نشاندہی کرتا ہے
- قیمتوں میں کمی کے ساتھ قیمتوں میں کمی کے ساتھ قیمتوں میں کمی
- آئی ایم آئی 30 سے کم ، دن کے دوران کم ہونے کی نشاندہی کرتا ہے
- ایم ایف آئی 20 سے کم ، جس سے پتہ چلتا ہے کہ پیسے کے بہاؤ کا دباؤ کم ہوگیا ہے
- ٹرگر کی شرائط:
- آر ایس آئی 70 سے اوپر ، جو مارکیٹ کو زیادہ خریدنے کی نشاندہی کرتا ہے
- قیمتیں بلین بینڈ سے زیادہ ٹریک پر ہیں ، جس سے قیمتوں میں زیادہ انحراف ظاہر ہوتا ہے
- آئی ایم آئی 70 سے زیادہ ، دن کے اندر اندر ہلچل کم ہونے کا اشارہ
- MFI 80 سے اوپر ، جس سے ظاہر ہوتا ہے کہ فنڈز کی آمد پر دباؤ کم ہوا ہے
- مضبوط سگنل کی شرائط روایتی سگنل کی بنیاد پر مزید سخت ترنگ کی ضروریات
اسٹریٹجک فوائد
- متعدد تکنیکی اشارے کی کراس توثیق ، سگنل کی وشوسنییتا میں نمایاں اضافہ
- باقاعدہ سگنل اور مضبوط سگنل میں فرق کریں ، پوزیشن کو لچکدار انداز میں ایڈجسٹ کریں
- حکمت عملی کی منطق واضح اور سادہ ہے، سمجھنے اور برقرار رکھنے میں آسان ہے
- انڈیکیٹر پیرامیٹرز ایڈجسٹ، لچکدار
- انٹیگریٹڈ فیڈ بیک آپشن ، حکمت عملی کو بہتر بنانے میں مدد کرتا ہے
اسٹریٹجک رسک
- کثیر اشارے کی ہم آہنگی سگنل کی تاخیر کا سبب بن سکتی ہے
حل: مناسب طور پر ٹرگر شرائط کو نرمی دینا ، یا رجحانات کا اندازہ لگانے والے اشارے متعارف کرانا - فکسڈ حد مختلف مارکیٹ کے حالات کے لئے موزوں نہیں ہو سکتا
حل: خودکشی کے لئے ایک تخفیف کا نظام متعارف کرانا - 4 گھنٹے کا دورانیہ مختصر مدت کے مواقع سے محروم ہوسکتا ہے
حل: ملٹی ٹائم سائیکل تجزیہ شامل کریں
حکمت عملی کی اصلاح کی سمت
- ایڈجسٹمنٹ ڈیوائسز متعارف کروائیں
متحرک طور پر اشارے کی تاریخی عددی گنتی کے ذریعہ سگنل کی حد کو ایڈجسٹ کریں ، حکمت عملی کی موافقت کو بہتر بنائیں - بڑھتی ہوئی رجحان کی طاقت فلٹرنگ
رجحان کی طاقت کے اشارے جیسے ADX متعارف کروائیں ، اتار چڑھاؤ کی منڈیوں میں جعلی سگنل کو فلٹر کریں - پوزیشن مینجمنٹ کو بہتر بنائیں
سگنل کی طاقت اور مارکیٹ میں اتار چڑھاو کی رفتار کے مطابق پوزیشن کا تناسب - سٹاپ نقصان روکنے کا طریقہ کار شامل کریں
ATR پر مبنی متحرک سٹاپ نقصان کی پوزیشن قائم کریں
خلاصہ کریں۔
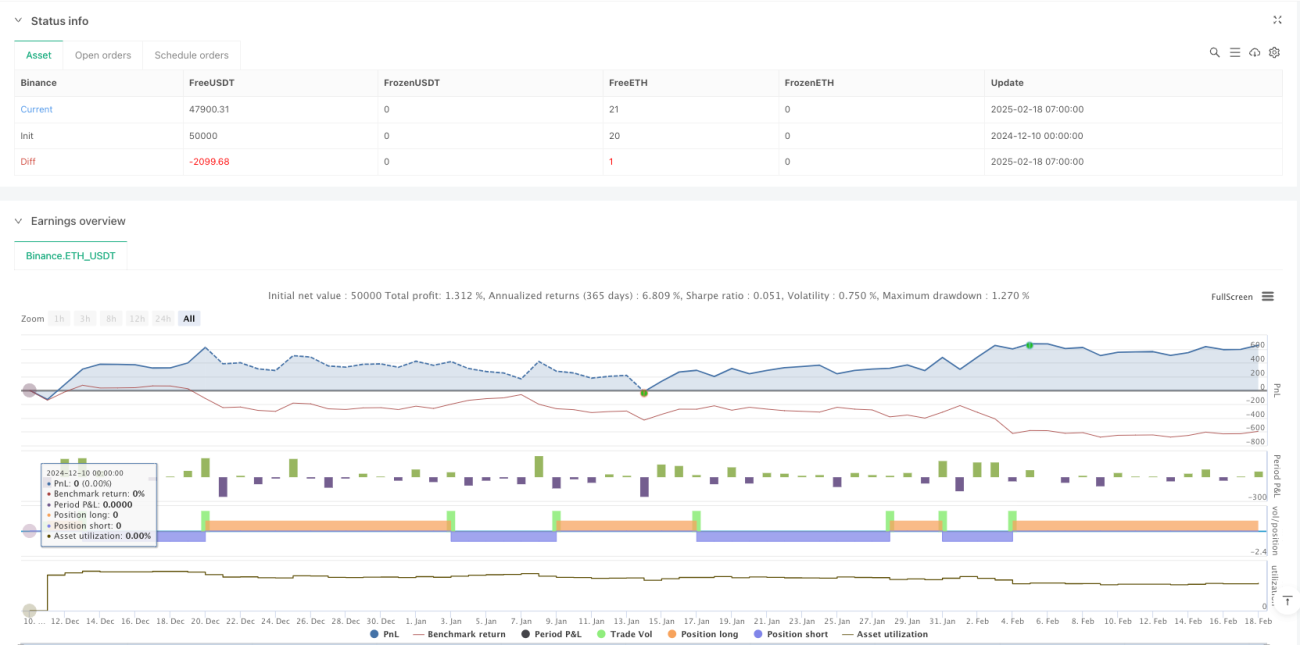
حکمت عملی نے متعدد کلاسیکی تکنیکی اشارے کے ہم آہنگی تجزیہ کے ذریعہ ایک نسبتا reliable قابل اعتماد تجارتی سگنل جنریٹنگ سسٹم تشکیل دیا۔ حکمت عملی کے ڈیزائن میں عملی اور قابل دیکھ بھال پر توجہ دی گئی ہے ، جبکہ کافی حد تک اصلاح کی گنجائش رکھی گئی ہے۔ معقول پیرامیٹرز کی ایڈجسٹمنٹ اور اصلاح کی سمت کے نفاذ کے ذریعہ ، حکمت عملی کو حقیقی تجارت میں مستحکم کارکردگی کا امکان ہے۔
- 1