ملٹی انڈیکیٹر کراس ٹرینڈ ٹریکنگ حکمت عملی فبونیکی ریٹیسمنٹ اور اسٹاپ پرافٹ اور اسٹاپ لاس آپٹیمائزیشن سسٹم کے ساتھ مل کر

جائزہ
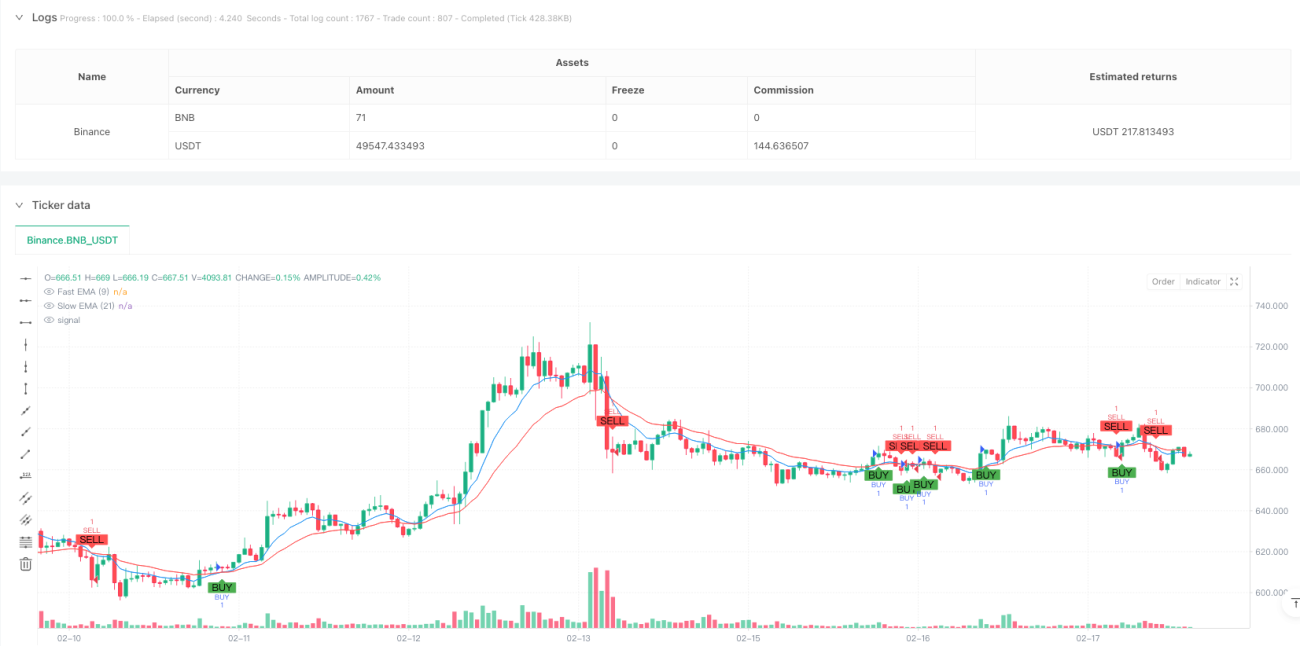
یہ حکمت عملی ایک جامع تجارتی نظام ہے جس میں انڈیکس کی حرکت پذیر اوسط ((EMA) کراسنگ ، فیبونیکی ریورس سطح ، رجحان کا فیصلہ اور اسٹاپ نقصان کا طریقہ کار شامل ہے۔ حکمت عملی 9 اور 21 دوروں کے EMA کے کراسنگ کے ذریعے تجارتی سگنل کی نشاندہی کرتی ہے ، جبکہ فیبونیکی ریورس سطح کو انٹری پوائنٹ کی پوزیشن کو بہتر بنانے کے لئے اور ٹریڈنگ کی درستگی کو بڑھانے کے لئے ریئل ٹائم ٹرینڈ اسٹیٹ مانیٹرنگ کے ساتھ جوڑتی ہے۔ یہ نظام فیصد اسٹاپ نقصان کا طریقہ کار بھی شامل کرتا ہے ، جو خطرے کو مؤثر طریقے سے کنٹرول کرتا ہے۔
حکمت عملی کا اصول
حکمت عملی کی بنیادی منطق درج ذیل کلیدی عناصر پر مبنی ہے:
- جب تیز رفتار EMA ((9 سائیکل) اوپر کی طرف سے سست رفتار EMA ((21 سائیکل) سے گزرتا ہے تو ، نظام ایک کثیر سگنل پیدا کرتا ہے
- جب تیز رفتار ای ایم اے نیچے کی طرف سے سست رفتار ای ایم اے کو پار کرتا ہے تو ، سسٹم ایک خالی سگنل پیدا کرتا ہے
- 100 سائیکلوں کی اعلی ترین اور کم ترین قیمتوں کا حساب لگاکر 23.6٪، 38.2٪، 50٪ اور 61.8٪ فیبونیکی ریٹرننگ کی سطح کا نقشہ بنائیں
- موجودہ رجحان کی حیثیت کا تعین فوری EMA کے ساتھ اختتامی قیمت کی پوزیشن کے تعلقات سے کیا جاتا ہے
- جب تجارت کی جاتی ہے تو ، سسٹم خود بخود ایک مقررہ فیصد اسٹاپ پوزیشن ((4٪) اور اسٹاپ نقصان ((2٪) مقرر کرتا ہے
اسٹریٹجک فوائد
- کثیر جہتی سگنل کی توثیق: EMA کراس ، فبونیکی سطح اور رجحان کی حیثیت کے ساتھ مل کر ، زیادہ قابل اعتماد تجارتی سگنل فراہم کریں
- بہتر خطرے کا انتظام: پہلے سے طے شدہ اسٹاپ اسٹاپ نقصان فی صد کے ذریعہ خود کار طریقے سے خطرے پر قابو پانا
- رجحانات کا سراغ لگانے کی صلاحیت: ای ایم اے کراسنگ رجحان کی حیثیت کا اندازہ لگانے کے ساتھ ، مارکیٹ کے رجحانات کو مؤثر طریقے سے پکڑ سکتا ہے
- واضح بصری آراء: اہم قیمتوں کی سطح ، رجحان کی حیثیت اور تجارتی سگنل کو ظاہر کرنے والے ٹیگ کے ذریعہ تجارتی فیصلے میں مدد کریں
- اعلی سطح پر نظام سازی: ٹریڈنگ کی منطق واضح ہے ، جس سے ذہنی فیصلے میں خلل پڑتا ہے
اسٹریٹجک رسک
- مارکیٹ میں اتار چڑھاؤ کا خطرہ: بار بار ای ایم اے کے کراس ہونے سے افقی صفائی کے مرحلے میں غلط سگنل پیدا ہوسکتے ہیں
- تاخیر کا خطرہ: حرکت پذیر اوسط بنیادی طور پر ایک تاخیر کا اشارہ ہے ، جس سے بہترین داخلے کا موقع ضائع ہوسکتا ہے
- فکسڈ اسٹاپ رسک: ایک مقررہ فیصد اسٹاپ جو تمام مارکیٹ کے حالات کے لئے موزوں نہیں ہوسکتا ہے۔
- سگنل تنازعہ کا خطرہ: متعدد اشارے کے مابین متضاد سگنل ہوسکتے ہیں ، جس سے فیصلہ سازی میں دشواری ہوتی ہے۔
- مارکیٹ میں اتار چڑھاؤ کا خطرہ: شدید اتار چڑھاؤ کے نتیجے میں غیر معقول اسٹاپ نقصان کا خطرہ
حکمت عملی کی اصلاح کی سمت
- متحرک اسٹاپ نقصان کی اصلاح: اے ٹی آر یا مارکیٹ میں اتار چڑھاو کی رفتار کے مطابق اسٹاپ نقصان کی فاصلے کو ایڈجسٹ کیا جاسکتا ہے
- سگنل فلٹرنگ میں اضافہ: جعلی سگنلوں کو فلٹر کرنے کے لئے ٹریفک ، طاقت اور دیگر معاون اشارے میں اضافہ کریں
- پیرامیٹرز کی موافقت: مارکیٹ کی صورتحال کے مطابق متحرک ای ایم اے سائیکل کو ایڈجسٹ کرنے کے لئے موافقت کا طریقہ کار متعارف کرایا گیا
- داخلہ کی اصلاح: قیمت کی شکل اور حجم کے ساتھ فبونیکی سطح کے قریب داخلہ کی اصلاح
- پوزیشن مینجمنٹ میں بہتری: متحرک پوزیشن مینجمنٹ سسٹم جو اتار چڑھاؤ اور اکاؤنٹ کے خطرے پر مبنی ہے
خلاصہ کریں۔
یہ حکمت عملی متعدد کلاسیکی تکنیکی تجزیہ کے اوزار کو مربوط کرکے ایک زیادہ مکمل تجارتی نظام تشکیل دیتی ہے۔ اس کا فائدہ سگنل کی تصدیق کی کثیر جہتی اور خطرے کے انتظام کے نظام سازی میں ہے ، لیکن پھر بھی اسے مختلف مارکیٹ کے حالات کے لئے بہتر بنانے کی ضرورت ہے۔ یہ تجویز کی جاتی ہے کہ جب تاجر اسے عملی طور پر استعمال کرتا ہے تو ، مارکیٹ کی مخصوص صورتحال کے ساتھ مل کر پیرامیٹرز کو بہتر طور پر ایڈجسٹ کرے ، اور ہمیشہ خطرے سے محتاط رہے۔
- 1