ملٹی بینڈ شماریاتی رجحان کے تجزیہ کی حکمت عملی

BB SMA EMA SD PL QB
تخلیق کی تاریخ: 2025-02-20 16:45:59 آخر میں ترمیم کریں: 2025-02-20 16:45:59
کاپی: 1 کلکس کی تعداد: 348
2
پر توجہ دیں
319
پیروکار

ملٹی بینڈ شماریاتی رجحان کے تجزیہ کی حکمت عملی ملٹی بینڈ شماریاتی رجحان کے تجزیہ کی حکمت عملی

جائزہ

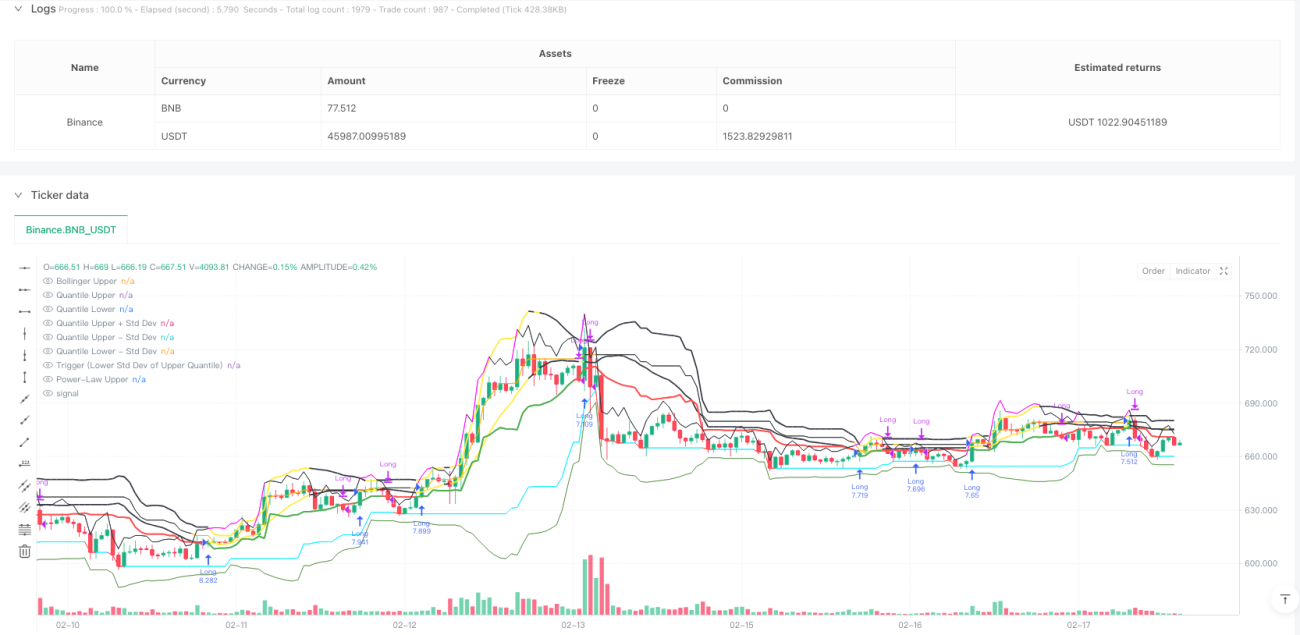
یہ ایک تجارتی حکمت عملی ہے جو متعدد اعدادوشمار کے بینڈ اور رجحانات کے تجزیے پر مبنی ہے۔ اس حکمت عملی میں اہم حمایت / مزاحمت کے علاقوں کی نشاندہی کرنے کے لئے برن بینڈ ، ڈجیٹل بینڈ ، اور ڈورینٹینس کا استعمال کیا گیا ہے ، اور اس میں داخل ہونے اور باہر نکلنے کے وقت کو طے کرنے کے لئے ٹرگر سگنل کے طور پر اوپری ڈجیٹل بینڈ کے نچلے معیاری فرق کا استعمال کیا گیا ہے۔ حکمت عملی میں مارکیٹ کی اتار چڑھاؤ کو پوری طرح سے مدنظر رکھا گیا ہے ، جس میں متعدد اعدادوشمار کے طریقوں کو جوڑ کر سگنل کی وشوسنییتا کو بہتر بنایا گیا ہے۔

حکمت عملی کا اصول

اس حکمت عملی کا بنیادی اصول مارکیٹ کے رجحانات کو متعدد اعدادوشمار کے بینڈ کے کراسنگ کے ذریعے پکڑنا ہے۔ اس میں بنیادی طور پر درج ذیل اہم اجزاء شامل ہیں:

  1. برن بینڈ سسٹم - قیمتوں میں اتار چڑھاؤ کی حد کا تعین کرنے کے لئے استعمال کیا جاتا ہے ، اور جب قیمت ٹریک سے باہر ہوجاتی ہے تو پیلے رنگ کے انتباہ میں تبدیل ہوجاتا ہے۔
  2. عددی نظام - قیمتوں کے اوپری اور نچلے اعشاریہ کا حساب لگانا ، قیمتوں کے انتہائی قیمت کے امکانات کا اندازہ لگانے کے لئے۔
  3. بانڈ سسٹم - تاریخی منافع پر مبنی نمایاں سطح کی پیمائش کرنے کے لئے استعمال کیا جاتا ہے۔
  4. ٹرگر سسٹم - اوپر والے ہندسوں کے بینڈ کے نیچے معیاری انحراف کی لائن کو بنیادی ٹرگر سگنل کے طور پر استعمال کیا جاتا ہے ، اور اس لائن سے اوپر کی قیمت کو برقرار رکھنے کو پیشن گوئی کا اشارہ سمجھا جاتا ہے۔
  5. تصدیق کا نظام - مسلسل تصدیق کے لائنوں کی تعداد کی ترتیب کے ذریعے جعلی سگنل کو فلٹر کریں۔

اسٹریٹجک فوائد

  1. مضبوط سگنل استحکام - ایک سے زیادہ اعداد و شمار کے بینڈ کا ایک ساتھ استعمال جعلی سگنل کو مؤثر طریقے سے کم کرتا ہے۔
  2. لچکدار - حکمت عملی مختلف وقت کے دور اور مارکیٹ کے حالات کے مطابق ڈھال سکتی ہے۔
  3. خطرے پر قابو پانے میں بہتری - متعدد اعدادوشمار کے ذریعہ خطرے والے علاقوں کو تقسیم کرنا ، جبکہ نقصان کو روکنے کا طریقہ کار بھی موجود ہے۔
  4. پیرامیٹر لچکدار - پیرامیٹرز کے اختیارات کی ایک وسیع رینج فراہم کرتا ہے جو مختلف مارکیٹ کی خصوصیات کے مطابق بہتر بنایا جاسکتا ہے۔
  5. واضح بصری - مختلف اشارے کی لائنوں کے رنگ واضح طور پر ممتاز ہیں ، اور تجارتی سگنل بدیہی ہیں۔

اسٹریٹجک رسک

  1. پسماندہ ہونے کا خطرہ - اعدادوشمار کے اشارے میں کچھ پسماندگی ہوتی ہے ، اور ممکنہ طور پر بہترین داخلے کے نقطہ نظر سے محروم ہوجاتے ہیں۔
  2. ہلچل والی منڈیوں کو نقصان پہنچا ہے - ہلچل والی منڈیوں میں بہت زیادہ ٹریڈنگ سگنل پیدا ہوسکتے ہیں۔
  3. پیرامیٹرز کی حساسیت - مختلف پیرامیٹرز کے مجموعے کے اثرات میں بہت زیادہ فرق ہے ، جس میں بار بار اصلاح کی ضرورت ہے۔
  4. کمپیوٹنگ کا بھاری بوجھ - کثیر اعداد و شمار کے اشارے کے ریئل ٹائم کمپیوٹنگ میں کمپیوٹنگ کے بڑے وسائل کی ضرورت ہوتی ہے۔
  5. مارکیٹ کے ماحول پر انحصار - انتہائی مارکیٹ کے ماحول میں ، اعدادوشمار کے قوانین غلط ہوسکتے ہیں۔

حکمت عملی کی اصلاح کی سمت

  1. متحرک پیرامیٹرز متعارف کروائیں - مارکیٹ میں اتار چڑھاؤ کی شرح کے مطابق پیرامیٹرز کو خود بخود ایڈجسٹ کریں۔
  2. مارکیٹ کے حالات کا اندازہ لگانے میں اضافہ کریں - رجحان کی طاقت کے اشارے کو فلٹر کرنے کے لئے رجحان کی طاقت کے اشارے شامل کریں.
  3. کمپیوٹنگ کی کارکردگی کو بہتر بنانا - جزوی کمپیوٹنگ کے عمل کو آسان بنانا ، وسائل کا استعمال کم کرنا۔
  4. بہتر خطرے کا کنٹرول - مزید اسٹاپ نقصان کی شرائط اور پوزیشن مینجمنٹ کی حکمت عملی شامل کریں۔
  5. موافقت کو بڑھانا - موافقت پذیر پیرامیٹرز کو بہتر بنانے کا نظام تیار کرنا

خلاصہ کریں۔

یہ ایک جامع رجحان سے باخبر رہنے کی حکمت عملی ہے جس میں متعدد اعدادوشمار کے طریقوں کا امتزاج کیا گیا ہے۔ بُرین بینڈ ، ڈگری بینڈ اور ڈورین بینڈ کے ہم آہنگی کے ذریعہ ، مارکیٹ کے رجحانات کو بہتر طور پر سمجھنے کے قابل ، اور اچھی طرح سے خطرے پر قابو پانے کی صلاحیت کے ساتھ۔ اگرچہ کچھ پسماندگی اور پیرامیٹرز کو بہتر بنانے میں دشواری ہے ، لیکن مستقل بہتری اور اصلاح کے ذریعہ ، اس حکمت عملی میں بہتر عملی قدر اور ترقی کے امکانات ہیں۔
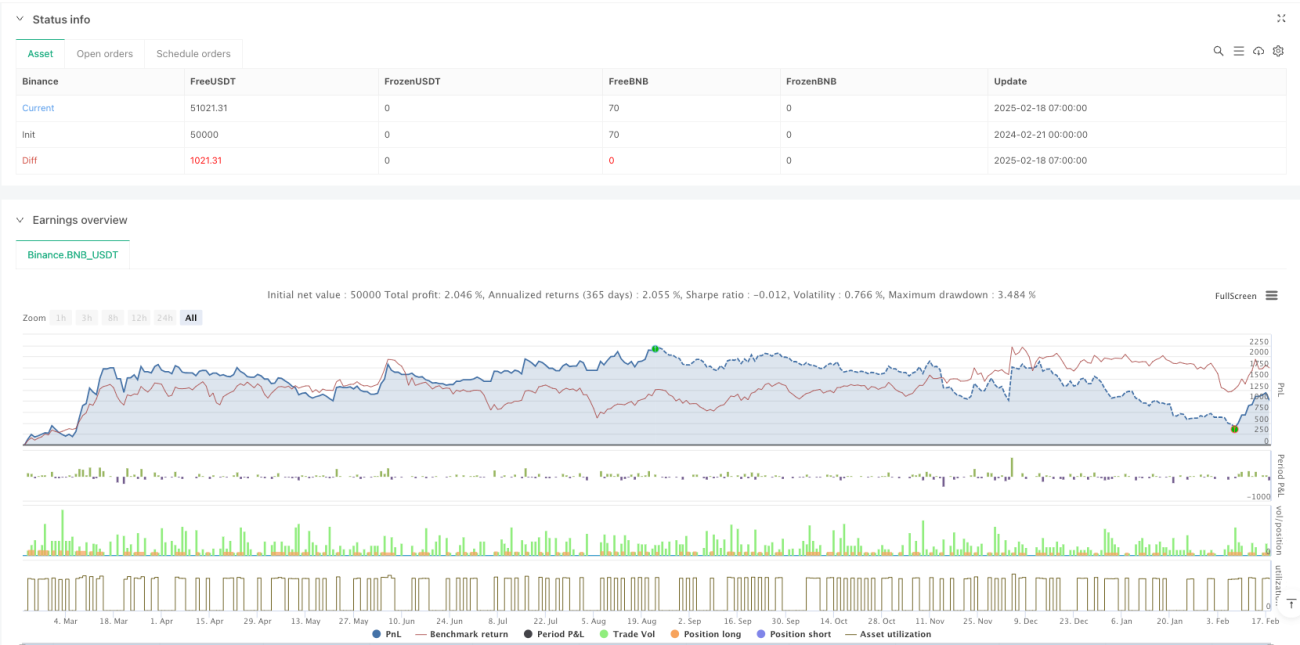
حکمت عملی کا ماخذ کوڈ
/*backtest
start: 2024-02-21 00:00:00
end: 2025-02-18 08:00:00
period: 1h
basePeriod: 1h
exchanges: [{"eid":"Binance","currency":"BNB_USDT"}]
*/

//@version=6
strategy("Multi-Band Comparison Strategy with Separate Entry/Exit Confirmation", overlay=true, 
         default_qty_type=strategy.percent_of_equity, default_qty_value=10, 
         initial_capital=5000, currency=currency.USD)

// === Inputs ===

// Basic Parameters
length         = input.int(20, "Length (SMA)", minval=1)
boll_mult      = input.float(1.0, "Bollinger Band Multiplier", minval=0.1, step=0.1)
upper_quantile = input.float(0.95, "Upper Quantile (0.0-1.0)", minval=0.0, maxval=1.0)
lower_quantile = input.float(0.05, "Lower Quantile (0.0-1.0)", minval=0.0, maxval=1.0)

// Separate confirmation inputs
entry_confirmBars = input.int(1, "Entry Confirmation Bars", minval=1, tooltip="Number of consecutive bars the entry condition must hold")
exit_confirmBars  = input.int(1, "Exit Confirmation Bars",  minval=1, tooltip="Number of consecutive bars the exit condition must hold")

// Toggle Visibility for Bands
show_lower_boll  = input.bool(false, "Show Lower Bollinger Band", tooltip="Enable or disable the lower Bollinger Band")
show_upper_boll  = input.bool(true,  "Show Upper Bollinger Band", tooltip="Enable or disable the upper Bollinger Band")
show_lower_quant = input.bool(true, "Show Lower Quantile Band", tooltip="Enable or disable the lower Quantile Band")
show_upper_quant = input.bool(true,  "Show Upper Quantile Band", tooltip="Enable or disable the upper Quantile Band")
show_upper_power = input.bool(true,  "Show Upper Power-Law Band", tooltip="Enable or disable the upper Power-Law Band")
show_lower_power = input.bool(false, "Show Lower Power-Law Band", tooltip="Enable or disable the lower Power-Law Band")
show_quant_std   = input.bool(true,  "Show Standard Deviation around Quantile Bands", tooltip="Enable or disable standard deviation lines around Quantile Bands")

// Individual Toggles for Std Dev Lines
show_upper_quant_std_up   = input.bool(true,  "Show Upper Quantile + Std Dev", tooltip="Enable or disable the Upper Quantile + Std Dev line")
show_upper_quant_std_down = input.bool(true,  "Show Upper Quantile - Std Dev", tooltip="Enable or disable the Upper Quantile - Std Dev line")
show_lower_quant_std_up   = input.bool(false, "Show Lower Quantile + Std Dev", tooltip="Enable or disable the Lower Quantile + Std Dev line")
show_lower_quant_std_down = input.bool(true,  "Show Lower Quantile - Std Dev", tooltip="Enable or disable the Lower Quantile - Std Dev line")

// Moving Average Toggles
show_ema = input.bool(false, "Show EMA", tooltip="Enable or disable the Exponential Moving Average")
show_sma = input.bool(false, "Show SMA", tooltip="Enable or disable the Simple Moving Average")

// EMA Parameters
ema_length = input.int(50, minval=1, title="EMA Length")
ema_source = input.source(close, title="EMA Source")

// === Data Handling ===

// Create persistent arrays to store data
var float[] data_array   = array.new_float()
var float[] return_array = array.new_float()

// Update the data array with the latest close prices
if array.size(data_array) < length
    array.push(data_array, close)
else
    array.shift(data_array)
    array.push(data_array, close)

// Update the return array with the latest returns
returns = close / close[1] - 1
if array.size(return_array) < length
    array.push(return_array, returns)
else
    array.shift(return_array)
    array.push(return_array, returns)

// === Helper Function ===

// Function to calculate a custom percentile
f_percentile(arr, quantile) =>
    arr_sorted = array.copy(arr)
    array.sort(arr_sorted, order.ascending)
    index = math.round((array.size(arr_sorted) - 1) * quantile)
    array.get(arr_sorted, index)

// === Calculations ===

// Bollinger Bands Calculation
sma        = ta.sma(close, length)
stdev      = ta.stdev(close, length)
boll_upper = sma + boll_mult * stdev
boll_lower = sma - boll_mult * stdev

// Power-Law Bands Calculation
var float power_upper = na
var float power_lower = na
if array.size(return_array) == length
    power_upper := f_percentile(return_array, upper_quantile)
    power_lower := f_percentile(return_array, lower_quantile)
var float power_upper_band = na
var float power_lower_band = na
if not na(power_upper) and not na(power_lower)
    power_upper_band := close * (1 + power_upper)
    power_lower_band := close * (1 + power_lower)

// Quantile Bands Calculation
var float quant_upper = na
var float quant_lower = na
if array.size(data_array) == length
    quant_upper := f_percentile(data_array, upper_quantile)
    quant_lower := f_percentile(data_array, lower_quantile)

// Standard Deviation around Quantile Bands
quant_upper_std_up   = quant_upper + stdev
quant_upper_std_down = quant_upper - stdev
quant_lower_std_up   = quant_lower + stdev
quant_lower_std_down = quant_lower - stdev

// === Color Calculations ===

// For the upper Bollinger band, color it yellow when price is above it, black otherwise.
upper_boll_color = close > boll_upper ? color.yellow : color.black

// The entry/exit trigger is based on the lower std dev band of the upper quantile band.
// It "turns green" (i.e. favorable for entry) when the price is above this level,
// and "turns red" (i.e. unfavorable, triggering an exit) when price is below it.
triggerCondition = close > quant_upper_std_down

// For plotting purposes, define the color of the lower std dev band of the upper quantile band:
triggerColor = triggerCondition ? color.green : color.red

// (Other color definitions remain for the additional bands.)
upper_power_color = (not na(power_upper_band) and not na(quant_upper_std_up) and power_upper_band > quant_upper_std_up) ? color.new(#FF00FF, 0) : color.black
upper_quant_color = (not na(quant_upper) and not na(power_upper_band) and power_upper_band > quant_upper) ? color.new(#FFAE00, 0) : color.rgb(50, 50, 50)
upper_quant_std_down_color = (not na(quant_upper_std_down) and close > quant_upper_std_down) ? color.green : color.red
lower_quant_std_down_color = (not na(quant_lower_std_down) and close > quant_lower_std_down) ? color.rgb(24, 113, 0, 44) : color.red
lower_quant_color = (ta.cross(close, quant_lower) or close == quant_lower) ? color.red : color.rgb(0, 238, 255)

// For demonstration, a variable to toggle a color on the Bollinger crossover.
var color upper_quant_std_up_color = color.black
if ta.crossover(close, boll_upper)
    upper_quant_std_up_color := color.yellow
if ta.crossunder(close, boll_upper)
    upper_quant_std_up_color := color.black

// === Confirmation Bars Logic with Separate Counters Based on Trigger Condition ===

// Use the trigger condition (based on the lower std dev band of the upper quantile band)
// for entry/exit confirmation.
var int entryCounter = 0
var int exitCounter  = 0

// When triggerCondition is true (price above quant_upper_std_down) the "green" state holds.
entryCounter := triggerCondition ? entryCounter + 1 : 0
// When triggerCondition is false (price below quant_upper_std_down) the "red" state holds.
exitCounter  := not triggerCondition ? exitCounter + 1 : 0

// === Strategy Orders ===

// Enter long when triggerCondition has been true for at least entry_confirmBars bars and no position is active.
if (entryCounter >= entry_confirmBars) and (strategy.position_size <= 0)
    strategy.entry("Long", strategy.long)

// Exit long when triggerCondition has been false for at least exit_confirmBars bars and a long position is active.
if (exitCounter >= exit_confirmBars) and (strategy.position_size > 0)
    strategy.close("Long")

// === Plotting ===

// Plot Bollinger Bands
plot(show_upper_boll ? boll_upper : na, color=upper_boll_color, title="Bollinger Upper", linewidth=2)
plot(show_lower_boll ? boll_lower : na, color=color.red, title="Bollinger Lower", linewidth=1)

// Plot Power-Law Bands
plot(show_upper_power ? power_upper_band : na, color=upper_power_color, title="Power-Law Upper", linewidth=1)
plot(show_lower_power ? power_lower_band : na, color=color.rgb(255, 59, 248), title="Power-Law Lower", linewidth=1)

// Plot Quantile Bands
plot(show_upper_quant ? quant_upper : na, color=upper_quant_color, title="Quantile Upper", linewidth=1)
plot(show_lower_quant ? quant_lower : na, color=lower_quant_color, title="Quantile Lower", linewidth=1)

// Plot Standard Deviation around Quantile Bands
plot(show_quant_std and show_upper_quant and show_upper_quant_std_up ? quant_upper_std_up : na, color=upper_quant_std_up_color, title="Quantile Upper + Std Dev", linewidth=2)
plot(show_quant_std and show_upper_quant and show_upper_quant_std_down ? quant_upper_std_down : na, color=upper_quant_std_down_color, title="Quantile Upper - Std Dev", linewidth=2)
plot(show_quant_std and show_lower_quant and show_lower_quant_std_up ? quant_lower_std_up : na, color=color.green, title="Quantile Lower + Std Dev", linewidth=1)
plot(show_quant_std and show_lower_quant and show_lower_quant_std_down ? quant_lower_std_down : na, color=lower_quant_std_down_color, title="Quantile Lower - Std Dev", linewidth=1)

// Also plot the trigger line (lower std dev band of upper quantile band) with its own color
plot(show_quant_std ? quant_upper_std_down : na, color=triggerColor, title="Trigger (Lower Std Dev of Upper Quantile)", linewidth=2)

// Plot SMA for reference
plot(show_sma ? sma : na, color=color.rgb(0, 24, 132), title="SMA", linewidth=3)

// Plot EMA for reference
ema_value = ta.ema(ema_source, ema_length)
plot(show_ema ? ema_value : na, color=color.rgb(147, 0, 0), title="EMA", linewidth=2)