متعدد ٹائم پیریڈز پر مبنی ڈائنامک ٹرینڈ ٹریڈنگ حکمت عملی ہرسٹ ایکسپوننٹ اور فبونیکی ریٹریسمنٹ

HURST FIBONACCI RSI MTF RR SL TP ATR
تخلیق کی تاریخ: 2025-02-20 16:59:37 آخر میں ترمیم کریں: 2025-02-20 16:59:37
کاپی: 2 کلکس کی تعداد: 393
2
پر توجہ دیں
319
پیروکار

متعدد ٹائم پیریڈز پر مبنی ڈائنامک ٹرینڈ ٹریڈنگ حکمت عملی ہرسٹ ایکسپوننٹ اور فبونیکی ریٹریسمنٹ متعدد ٹائم پیریڈز پر مبنی ڈائنامک ٹرینڈ ٹریڈنگ حکمت عملی ہرسٹ ایکسپوننٹ اور فبونیکی ریٹریسمنٹ

جائزہ

یہ ایک جدید کثیر وقتی دورانیہ کی تجارتی حکمت عملی ہے جو ہرسٹ ایکسپوننٹ اور فبونیکی ریٹرو لیول کو یکجا کرتی ہے۔ یہ حکمت عملی مارکیٹ کے رجحان کی خصوصیات کا اندازہ لگانے کے لئے مختلف وقت کی مدت کے لئے ہرسٹ ایکسپوننٹ کا حساب لگاتی ہے اور ممکنہ تجارتی مواقع کی نشاندہی کرنے کے لئے فبونیکی اہم قیمت کی سطح کے ساتھ ملتی ہے۔ اس حکمت عملی میں ایک سخت رسک مینجمنٹ فریم ورک استعمال کیا جاتا ہے ، جس میں فکسڈ رسک تناسب ، ہدف منافع اور نقصان کا تناسب ، اور روزانہ اور مجموعی طور پر تجارت کی فریکوئنسی کی حد شامل ہے۔

حکمت عملی کا اصول

اس حکمت عملی کی بنیادی منطق دو اہم اجزاء پر مبنی ہے:

  1. موجودہ اور اس سے زیادہ وقت کے دورانیے کے لئے ہسٹرسٹ انڈیکس کا حساب کرکے مارکیٹ کی رجحان کی نوعیت کا اندازہ لگائیں۔ ہسٹرسٹ انڈیکس 0.5 سے زیادہ کا مطلب ہے کہ مارکیٹ میں رجحانات کا تسلسل ہے ، اور 0.5 سے کم کا مطلب یہ ہے کہ مارکیٹ میں اوسط واپسی کی خصوصیات ہوسکتی ہیں۔
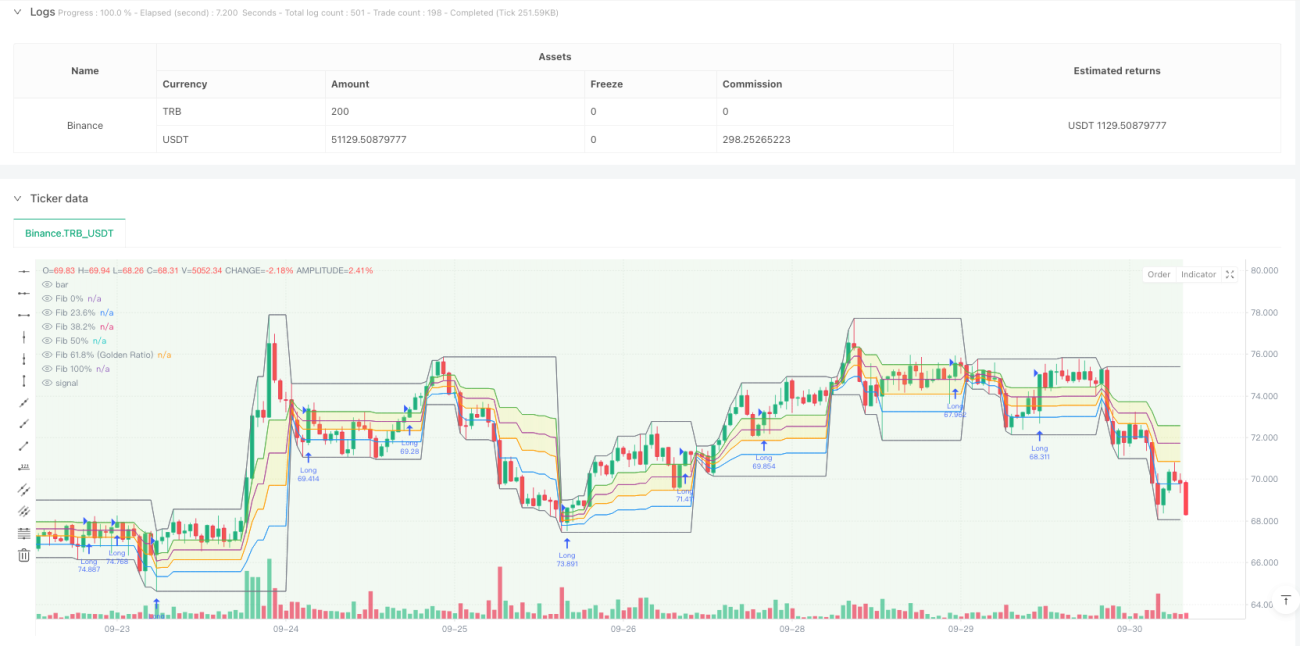
  2. روزانہ اونچائی کی کم قیمتوں کا حساب لگانے کے لئے اہم فیبونیکی واپسی کی سطح کا استعمال کرتے ہوئے ، 61.8٪ ((گولڈ ڈویژن) اور 38.2٪ دونوں سطحوں پر توجہ دیں۔ جب دن کی لائن ہسٹری انڈیکس 0.5 سے زیادہ ہے اور قیمت 61.8٪ کی سطح کو عبور کرتی ہے تو ، ایک سے زیادہ سگنل لگائیں۔ جب دن کی لائن ہسٹری انڈیکس 0.5 سے کم ہے اور قیمت 38.2٪ کی سطح سے نیچے گرتی ہے تو ، ایک خالی سگنل لگائیں۔

اسٹریٹجک فوائد

  1. کثیر جہتی تجزیہ: مختلف وقت کے ادوار کے رجحانات اور قیمت کی سطح کے تجزیہ کو یکجا کرکے مارکیٹ کا ایک جامع نقطہ نظر فراہم کرنا
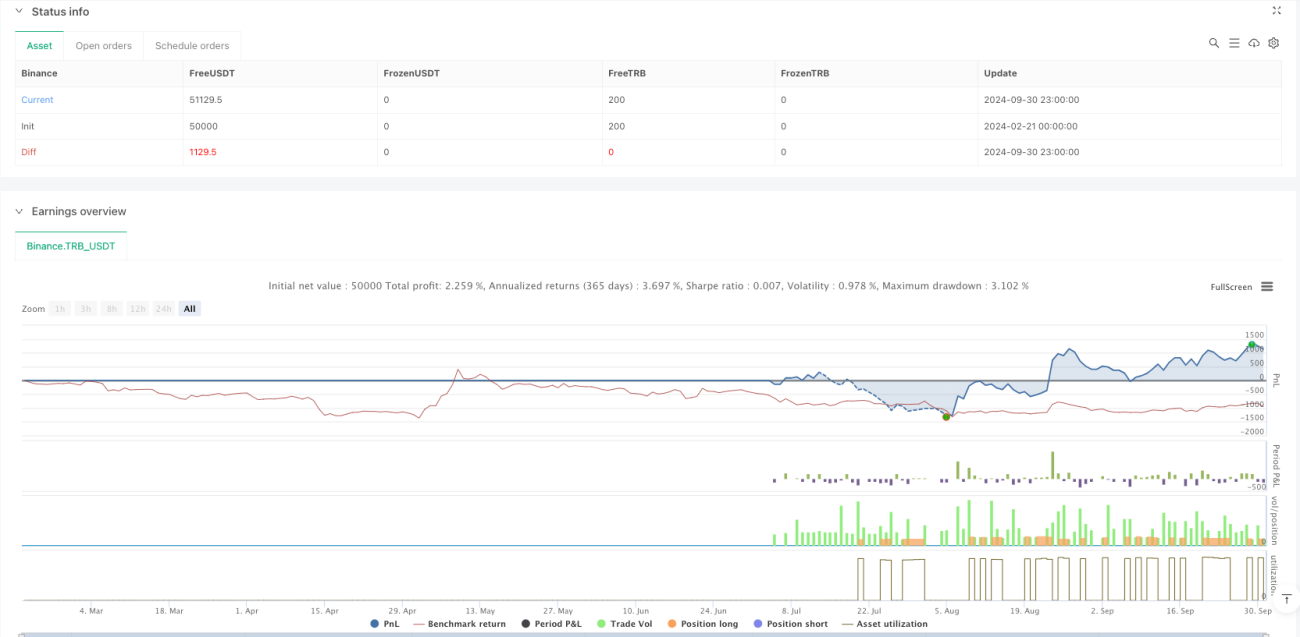
  2. خطرہ مینجمنٹ میں بہتری: خطرہ مینجمنٹ فریم ورک جس میں فکسڈ خطرہ تناسب ((2٪) اور ہدف منافع نقصان کا تناسب ((1: 2) ہے
  3. ٹریڈنگ فریکوئینسی کنٹرول: روزانہ کی زیادہ سے زیادہ تجارت اور مجموعی تجارت کی حد مقرر کریں تاکہ زیادہ تجارت سے بچا جاسکے
  4. بصری معاونت: مارکیٹ کے رجحانات ، پس منظر کے رنگ میں تبدیلی اور کلیدی اشارے کے بارے میں معلومات کے ساتھ ایک ٹیبل

اسٹریٹجک رسک

  1. مارکیٹ کے ماحول پر انحصار: غیر واضح رجحانات کے ساتھ ہراس مارکیٹ میں ممکنہ طور پر خراب کارکردگی کا مظاہرہ کرنا
  2. پیرامیٹر حساسیت: ہسٹ انڈیکس حساب کتاب کے دورانیے اور فبونیکی ٹائم پیریڈ کا انتخاب حکمت عملی کی کارکردگی کو متاثر کرتا ہے
  3. سلائڈنگ اثرات: کم لیکویڈیٹی والے مارکیٹ کے حالات میں سلائڈنگ کا زیادہ خطرہ ہوسکتا ہے۔
  4. سسٹم کی پیچیدگی: متعدد اجزاء کا مجموعہ حکمت عملی کی ناکامی کا امکان بڑھاتا ہے

حکمت عملی کی اصلاح کی سمت

  1. متحرک پیرامیٹرز ایڈجسٹمنٹ: مارکیٹ میں اتار چڑھاؤ کی بنیاد پر خود کار طریقے سے ایڈجسٹ کر سکتے ہیں ہسٹ انڈیکس حساب کتاب کی مدت
  2. اضافی فلٹرز: اضافی مارکیٹ اسٹیٹ فلٹرز متعارف کرانے سے سگنل کے معیار میں اضافہ ہوتا ہے
  3. پوزیشن مینجمنٹ کو بہتر بنانا: متحرک پوزیشن مینجمنٹ کی بنیاد پر اتار چڑھاؤ
  4. بہتر آؤٹ پٹ میکانزم: منافع کے اہداف کے ل more زیادہ لچکدار طریقوں کی ترقی

خلاصہ کریں۔

یہ ایک جدید حکمت عملی ہے جو تکنیکی تجزیہ کے کلاسیکی ٹولز کو جدید مقداری طریقوں کے ساتھ جوڑتی ہے۔ متعدد ٹائم سائیکل تجزیہ اور سخت رسک مینجمنٹ کے ذریعہ ، حکمت عملی نظریاتی بنیاد کو برقرار رکھتے ہوئے عملی عملیتا پر بھی توجہ دیتی ہے۔ اگرچہ اصلاح کی ایک خاص گنجائش موجود ہے ، لیکن مجموعی طور پر فریم ورک میں اچھی توسیع اور عملی قدر ہے۔

حکمت عملی کا ماخذ کوڈ
/*backtest
start: 2024-02-21 00:00:00
end: 2024-10-01 00:00:00
period: 1h
basePeriod: 1h
exchanges: [{"eid":"Binance","currency":"TRB_USDT"}]
*/

//@version=5
// Advanced Multi-Timeframe Trading System (Risk Managed)
// 
// Description:
// This strategy combines an approximate measure of market trending via a Hurst exponent
// calculation with Fibonacci retracement levels derived from a higher timeframe (default: Daily)
// to identify potential reversal zones and trade opportunities. The Hurst exponent is calculated
// as a rough indicator of market persistence, while the Fibonacci retracement levels provide potential
// support and resistance areas.
// 
// Signal Logic:
// - A long entry is signaled when the price crosses above the 61.8% Fibonacci level (Golden Ratio)
//   and the daily Hurst exponent is above 0.5 (suggesting a trending market).
// - A short entry is signaled when the price crosses below the 38.2% Fibonacci level and the daily Hurst
//   exponent is below 0.5.
// 
// Risk Management:
// Each trade is risk-managed with a stop-loss set at 2% below (or above for shorts) the entry price,
// and a take profit order is set to achieve a 1:2 risk-reward ratio. Position sizing is fixed at 10% of
// equity per trade. Additionally, the strategy limits trading to a maximum of 5 trades per day and 510 trades
// overall (for backtesting since 2019) to ensure a realistic number of orders.
// 
// Backtesting Parameters:
// - Initial Capital: $10,000
// - Commission: 0.1% per trade
// - Slippage: 1 tick per bar
// - Position Sizing: 10% of equity per trade
// 
// Disclaimer:
// Past performance is not indicative of future results. This strategy is experimental and is provided solely
// for educational purposes. Use caution and perform your own testing before any live deployment.
// 
// Author: [Your Name]
// Date: [Date]

strategy("Advanced Multi-Timeframe Trading System (Risk Managed)",
     overlay=true, 
     max_bars_back=500, 
     initial_capital=10000, 
     default_qty_type=strategy.percent_of_equity, 
     default_qty_value=10,          // 10% of equity per trade
     commission_type=strategy.commission.percent, 
     commission_value=0.1,          // 0.1% commission per trade
     slippage=1,                    // 1 tick per bar
     calc_on_order_fills=true, 
     calc_on_every_tick=true)

// ─── INPUTS ─────────────────────────────────────────────────────────────
hurstLen        = input.int(50, title="Hurst Lookback Period", minval=10)
fibTF           = input.timeframe("D", title="Fibonacci Retracement Timeframe")
maxTradesPerDay = input.int(5, title="Max Trades Per Day", minval=1)
maxTotalTrades  = input.int(510, title="Max Total Trades since 2019", minval=1)
riskPerc        = input.float(2.0, title="Risk Percent per Trade (%)", step=0.1) * 0.01  // 2% risk per trade
rrRatio         = input.float(2.0, title="Risk-Reward Ratio", step=0.1)                 // Target profit = 2x risk

// ─── FUNCTION: Approximate Hurst Exponent Calculation ──────────────────────
// This function uses a simple rescaled range method to approximate the Hurst exponent.
// Note: This is an experimental calculation and should be interpreted as a rough gauge of market trending.
calcHurst(src, len) =>
    mean   = ta.sma(src, len)
    dev    = src - mean
    cumDev = 0.0
    for i = 0 to len - 1
        cumDev := cumDev + dev[i]
    R     = ta.highest(cumDev, len) - ta.lowest(cumDev, len)
    S     = ta.stdev(src, len)
    hurst = na(S) or S == 0 ? na : math.log(R / S) / math.log(len)
    hurst

// Calculate the Hurst exponent on the current timeframe and from a higher timeframe (daily)
currHurst  = calcHurst(close, hurstLen)
dailyHurst = request.security(syminfo.tickerid, "D", calcHurst(close, hurstLen))

// ─── FIBONACCI RETRACEMENT LEVELS (WITH GOLDEN RATIO) ──────────────────────────
// Retrieve the daily high/low from the selected timeframe (default: Daily)
dHigh   = request.security(syminfo.tickerid, fibTF, high)
dLow    = request.security(syminfo.tickerid, fibTF, low)

// Define Fibonacci levels between the daily low and high.
fib_0   = dLow
fib_100 = dHigh
fib_236 = dLow + 0.236 * (dHigh - dLow)
fib_382 = dLow + 0.382 * (dHigh - dLow)
fib_500 = dLow + 0.5   * (dHigh - dLow)
fib_618 = dLow + 0.618 * (dHigh - dLow)  // Golden ratio level

// Plot the Fibonacci levels for reference.
pFib0   = plot(fib_0,   color=color.gray,   title="Fib 0%")
pFib236 = plot(fib_236, color=color.blue,   title="Fib 23.6%")
pFib382 = plot(fib_382, color=color.orange, title="Fib 38.2%")
pFib500 = plot(fib_500, color=color.purple, title="Fib 50%")
pFib618 = plot(fib_618, color=color.green,  title="Fib 61.8% (Golden Ratio)")
pFib100 = plot(fib_100, color=color.gray,   title="Fib 100%")
// Fill the area between the 61.8% and 38.2% levels to highlight the key retracement zone.
fill(pFib618, pFib382, color=color.new(color.yellow, 80), title="Fibonacci Retracement Zone")

// ─── TRADE COUNT MANAGEMENT ─────────────────────────────────────────────────
// To simulate realistic trading frequency, the strategy limits trades to a maximum of 5 per day and 510 overall.
var int tradesToday     = 0
var int globalTradeCount = 0

// Reset the daily trade counter at the start of a new day.
newDay = ta.change(time("D"))
if newDay
    tradesToday := 0

// Allow new trades only if within the daily and overall trade limits.
canTrade = (tradesToday < maxTradesPerDay) and (globalTradeCount < maxTotalTrades)

// ─── TRADING SIGNALS ─────────────────────────────────────────────────────────
// Entry conditions based on Fibonacci levels and daily Hurst conditions:
// • Long: Price crosses above the 61.8% (Golden Ratio) level and daily Hurst > 0.5.
// • Short: Price crosses below the 38.2% level and daily Hurst < 0.5.
longCond  = ta.crossover(close, fib_618) and (dailyHurst > 0.5)
shortCond = ta.crossunder(close, fib_382) and (dailyHurst < 0.5)

if longCond and canTrade
    strategy.entry("Long", strategy.long)
    tradesToday      := tradesToday + 1
    globalTradeCount := globalTradeCount + 1

if shortCond and canTrade
    strategy.entry("Short", strategy.short)
    tradesToday      := tradesToday + 1
    globalTradeCount := globalTradeCount + 1

// ─── RISK MANAGEMENT: STOP-LOSS & TAKE-PROFIT ──────────────────────────────
// For active positions, define stop-loss and take profit levels based on the entry price.
// This ensures that each trade risks approximately 2% of the entry price with a target
// of 2x the risk (1:2 risk-reward ratio).
if strategy.position_size > 0
    longStop   = strategy.position_avg_price * (1 - riskPerc)
    longTarget = strategy.position_avg_price * (1 + rrRatio * riskPerc)
    strategy.exit("Long Exit", from_entry="Long", stop=longStop, limit=longTarget)
if strategy.position_size < 0
    shortStop   = strategy.position_avg_price * (1 + riskPerc)
    shortTarget = strategy.position_avg_price * (1 - rrRatio * riskPerc)
    strategy.exit("Short Exit", from_entry="Short", stop=shortStop, limit=shortTarget)

// ─── CHART OVERLAYS & VISUAL AIDS ────────────────────────────────────────────
// Background color indicates the daily market trend:
// Green for trending conditions (dailyHurst > 0.5) and red for less trending conditions.
bgcolor(dailyHurst > 0.5 ? color.new(color.green, 90) : color.new(color.red, 90), title="Daily Trend Background")

// Display an information table in the top-right corner to help interpret key values.
var table infoTable = table.new(position.top_right, 2, 4, border_width=1, frame_color=color.gray)
if barstate.islast
    table.cell(infoTable, 0, 0, "Current Hurst", text_color=color.white, bgcolor=color.black)
    table.cell(infoTable, 1, 0, str.tostring(currHurst, "#.###"), text_color=color.white, bgcolor=color.black)
    table.cell(infoTable, 0, 1, "Daily Hurst", text_color=color.white, bgcolor=color.black)
    table.cell(infoTable, 1, 1, str.tostring(dailyHurst, "#.###"), text_color=color.white, bgcolor=color.black)
    table.cell(infoTable, 0, 2, "Trades Today", text_color=color.white, bgcolor=color.black)
    table.cell(infoTable, 1, 2, str.tostring(tradesToday), text_color=color.white, bgcolor=color.black)
    table.cell(infoTable, 0, 3, "Global Trades", text_color=color.white, bgcolor=color.black)
    table.cell(infoTable, 1, 3, str.tostring(globalTradeCount), text_color=color.white, bgcolor=color.black)

// Optional: Add labels on the final bar to mark the key Fibonacci levels.
if barstate.islast
    label.new(bar_index, fib_618, "61.8% (Golden Ratio)", style=label.style_label_left, color=color.green, textcolor=color.white, size=size.tiny)
    label.new(bar_index, fib_382, "38.2%", style=label.style_label_left, color=color.orange, textcolor=color.white, size=size.tiny)