
جائزہ
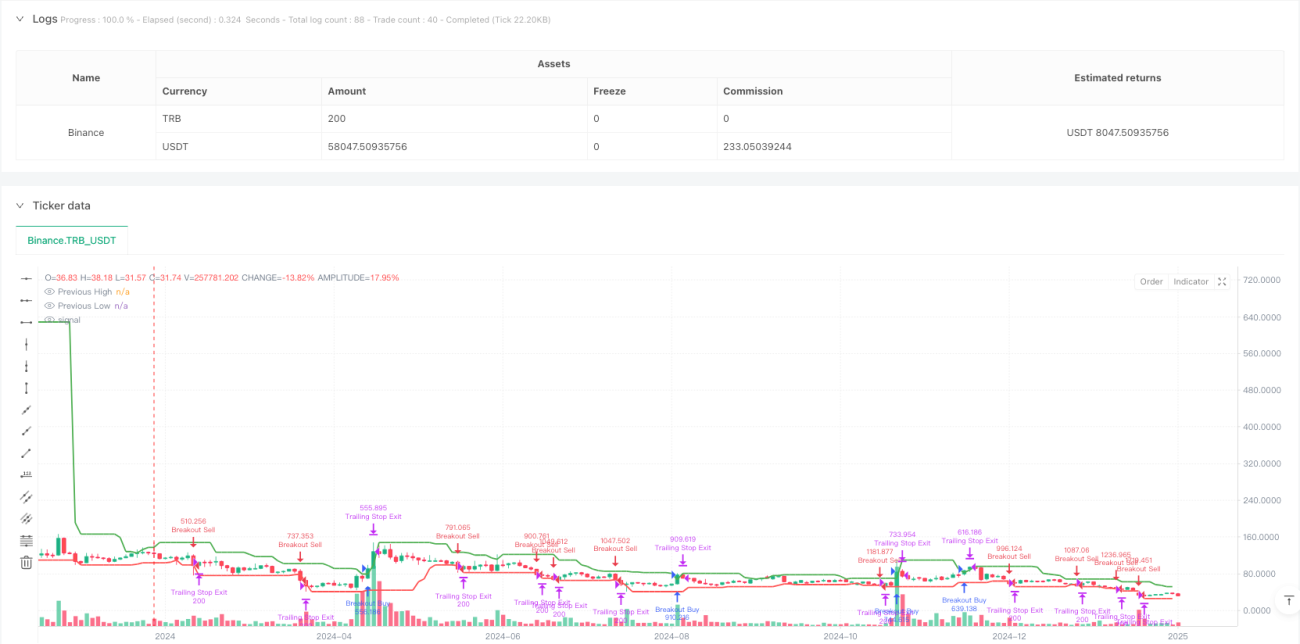
یہ حکمت عملی ایک ٹریڈنگ سسٹم ہے جس میں قیمتوں کے توڑ اور متحرک ٹریکنگ اسٹاپ نقصانات پر مبنی ہے۔ یہ پچھلے N سائیکلوں کی اعلی ترین اور کم ترین قیمتوں کی نگرانی کرکے تجارت کرتا ہے ، جب قیمتیں ان اہم سطحوں کو توڑ دیتی ہیں۔ حکمت عملی میں ایک ذہین اسٹاپ نقصان کا طریقہ کار استعمال کیا گیا ہے ، جس میں ٹریکنگ اسٹاپ نقصانات کو صرف 1 فیصد منافع کے بعد ہی چالو کیا جاتا ہے ، جس سے منافع کو مکمل طور پر ترقی دی جاسکتی ہے۔
حکمت عملی کا اصول
حکمت عملی کی بنیادی منطق میں درج ذیل اہم حصے شامل ہیں:
- انٹری سگنل: پچھلے N سائیکلوں کی اعلی ترین اور کم ترین قیمتوں کا حساب کتاب کرکے ، جب موجودہ قیمت ان سطحوں کو توڑ دیتی ہے تو تجارتی سگنل کو متحرک کرتی ہے۔ کثیر سر انٹری کی ضرورت ہوتی ہے کہ قیمت پچھلے دور کی اونچائی کو توڑنے کی ایک خاص فیصد ہے ، اور خالی سر کو پچھلے دور کی کم سطح کو توڑنے کی ضرورت ہے۔
- ٹریڈنگ مینجمنٹ: ایک گھنٹہ کی ٹھنڈک کی مدت کا اطلاق کریں تاکہ شدید اتار چڑھاؤ کے دوران بار بار تجارت سے گریز کیا جاسکے۔
- رسک کنٹرول: متحرک ٹریکنگ سٹاپ کا استعمال کرتے ہوئے ، صرف 1٪ منافع حاصل کرنے کے بعد چالو کرنا ، منافع کو بہتر طور پر محفوظ کرنا۔
- پیرامیٹرز کی اصلاح: کلیدی پیرامیٹرز جیسے ریورس سائیکل ، توڑنے والی حد ، سٹاپ نقصان کا فیصد وغیرہ مختلف مارکیٹ کے حالات کے مطابق ایڈجسٹ کیا جاسکتا ہے۔
اسٹریٹجک فوائد
- متحرک رسک مینجمنٹ: اسٹریٹجیز کو روکنے کے نقصانات کا سراغ لگانے کے ذریعہ ، منافع کو برقرار رکھنے کے ساتھ ساتھ منافع کو بھی برقرار رکھنے کی اجازت دی جاسکتی ہے۔
- لچکدار موافقت: حکمت عملی مختلف مارکیٹ کے حالات کے مطابق ڈھال سکتی ہے تاکہ پیرامیٹرز کو ایڈجسٹ کرکے کارکردگی کو بہتر بنایا جاسکے۔
- فلٹرنگ میکانزم: ٹرانزیکشن کولنگ پیریڈ کا استعمال زیادہ تجارت سے بچنے اور تجارت کے معیار کو بہتر بنانے کے لئے کیا جاتا ہے۔
- سادہ اور موثر: حکمت عملی کی منطق واضح ہے ، سمجھنے اور عملدرآمد میں آسان ہے ، جبکہ بہتر توسیع پذیری کو برقرار رکھا گیا ہے۔
اسٹریٹجک رسک
- جعلی بریک کا خطرہ: مارکیٹ میں جعلی بریک ہوسکتی ہے ، جس سے غلط سگنل ملتا ہے۔ ٹرانزیکشن کی تصدیق میں اضافہ کرنے کی تجویز ہے۔
- سلائڈ پوائنٹ اثر: اعلی اتار چڑھاؤ کے دوران ، حکمت عملی کی کارکردگی کو متاثر کرنے والے بڑے سلائڈ پوائنٹس کا سامنا کرنا پڑ سکتا ہے۔
- پیرامیٹر حساسیت: حکمت عملی کی کارکردگی پیرامیٹرز کی ترتیبات سے زیادہ حساس ہے ، جس میں محتاط اصلاح کی ضرورت ہے۔
- مارکیٹ کے ماحول پر انحصار: کم اتار چڑھاؤ کے ماحول میں خراب کارکردگی کا مظاہرہ کرسکتا ہے۔
حکمت عملی کی اصلاح کی سمت
- ٹرانزیکشن اشارے متعارف کروائے گئے: ٹرانزیکشن کی تصدیق کے ذریعہ بریک سگنل کی وشوسنییتا کو بہتر بنائیں۔
- رجحانات کو فلٹر کریں: صرف رجحانات کی سمت میں تجارت کریں ، طویل مدتی رجحانات کے اشارے کے ساتھ مل کر
- متحرک پیرامیٹرز کی ایڈجسٹمنٹ: مارکیٹ میں اتار چڑھاؤ کی شرح کے مطابق خود کار طریقے سے توڑنے کی حد اور اسٹاپ نقصان کی پیرامیٹرز کو ایڈجسٹ کریں۔
- ایک سے زیادہ ٹائم پیکیج: درستگی کو بہتر بنانے کے لئے ایک سے زیادہ ٹائم پیکیج کے سگنل کو ضم کریں۔
خلاصہ کریں۔
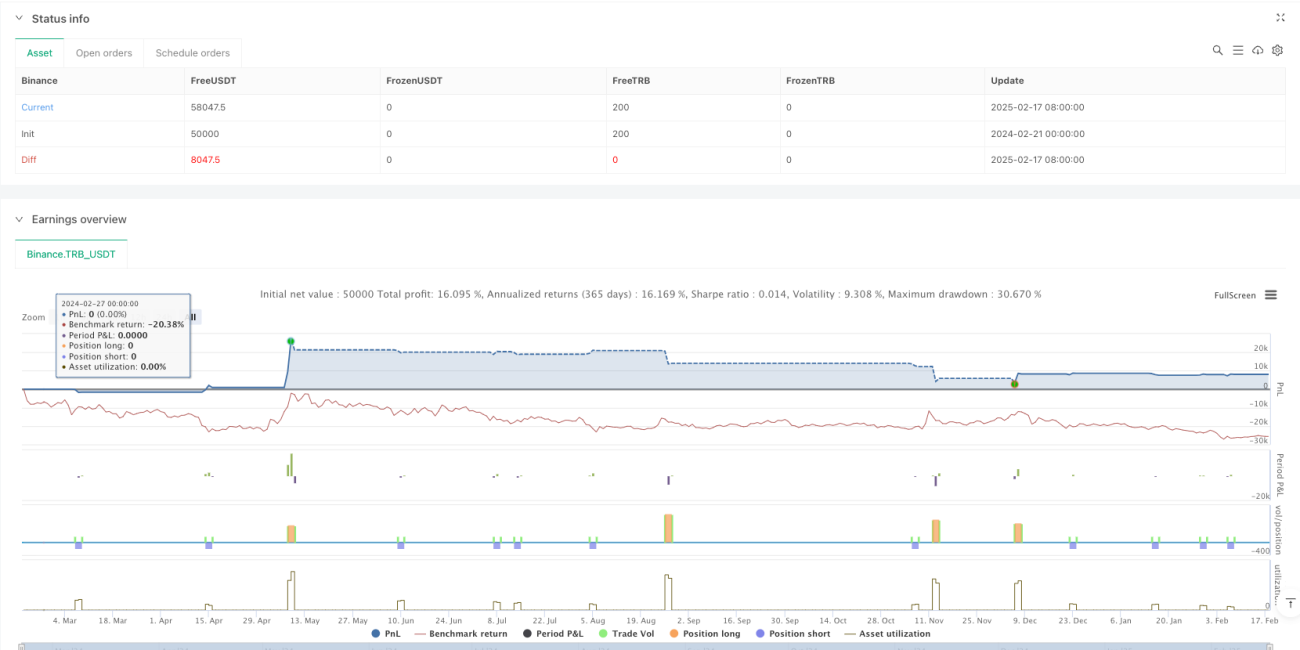
یہ ایک مناسب ڈیزائن کردہ رجحان سے باخبر رہنے کی حکمت عملی ہے ، جس میں قیمتوں میں اضافے اور متحرک رکاوٹوں کا امتزاج کیا گیا ہے ، جو بڑے رجحانات کو پکڑنے کے ساتھ ساتھ خطرے کو مؤثر طریقے سے کنٹرول کرنے کے قابل ہے۔ حکمت عملی کی تخصیص پذیری مضبوط ہے ، اور پیرامیٹرز کی اصلاح کے ذریعہ مختلف مارکیٹ کے حالات کے مطابق ڈھال سکتی ہے۔ یہ مشورہ دیا جاتا ہے کہ حکمت عملی کو مختلف مارکیٹ کے حالات میں کارکردگی کی توثیق کرنے کے لئے عملی طور پر چھوٹے عہدوں سے شروع کریں۔
- 1