
جائزہ
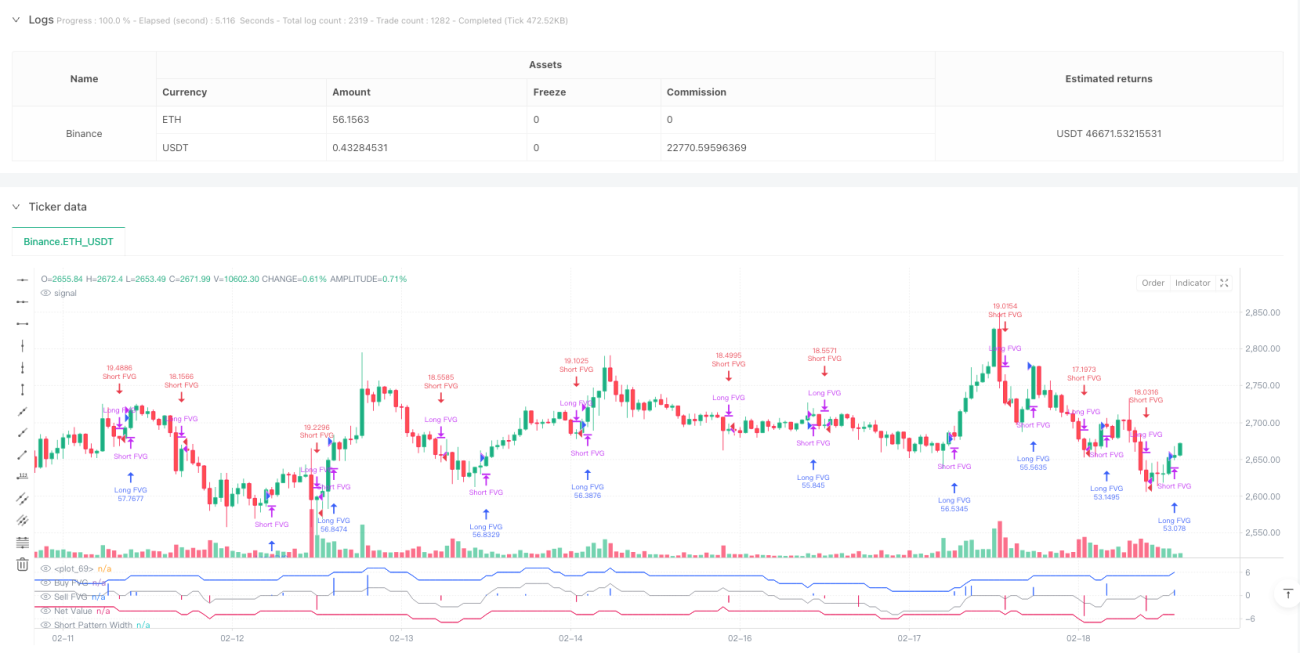
یہ حکمت عملی ایک جدید ٹریڈنگ سسٹم ہے جو فاریکس ویلیو گیپ (FVG) پر مبنی ہے ، جو مارکیٹ میں قیمت کے فرق اور غیر معمولی حجم کی شناخت کے ذریعہ ممکنہ تجارتی مواقع کو پکڑتا ہے۔ اس حکمت عملی میں متحرک گنتی کا طریقہ کار اور یکساں پروسیسنگ شامل ہے ، جو نہ صرف خرید و فروخت کے اشاروں کی درست شناخت کرنے کے قابل ہے بلکہ اس کی بصری نمائش کے ذریعہ تاجروں کو مارکیٹ کی ساخت کو بہتر طور پر سمجھنے میں مدد فراہم کرتی ہے۔
حکمت عملی کا اصول
اس حکمت عملی کا بنیادی مقصد ممکنہ تجارتی مواقع کی نشاندہی کرنا ہے جس میں لگاتار K لائنوں کے مابین قیمتوں کے فرق کی نگرانی کی جاتی ہے۔ خاص طور پر:
- کثیر سر FVG ((BFVG) کی تشکیل کی شرط یہ ہے کہ موجودہ K لائن کی کم از کم قیمت دو K لائنوں سے پہلے کی زیادہ سے زیادہ قیمت سے زیادہ ہے۔
- خالی سر FVG ((SFVG) کی تشکیل کی شرط یہ ہے کہ موجودہ K لائن کی اعلی قیمت دو K لائنوں سے پہلے کی کم قیمت سے کم ہے
- حکمت عملی میں ٹرانزیکشن حجم اور سوراخ کے سائز پر مبنی توثیق کا طریقہ کار متعارف کرایا گیا ہے ، صرف ایف وی جی جو توثیق کی شرائط پر پورا اترتا ہے وہ تجارتی سگنل کو متحرک کرتا ہے
- 50 سائیکلوں کے ساتھ متحرک گنتی ونڈو کا استعمال کرتے ہوئے فضائی FVG کی تعداد کو جمع کرنے کے لئے
- انگوٹھے کی چوڑائی کو یکساں پروسیسنگ کے ذریعہ زیادہ بدیہی اشارے میں تبدیل کرنا
اسٹریٹجک فوائد
- سسٹم میں سگنل کی توثیق کا ایک مکمل طریقہ کار ہے ، جس میں ٹرانزیکشن کی مقدار اور سوراخ کی چوڑائی کی دوہری تصدیق کے ذریعہ سگنل کے معیار کو بہتر بنایا گیا ہے۔
- متحرک گنتی ونڈو مارکیٹ کے رجحانات میں تبدیلی کو مؤثر طریقے سے پکڑ سکتی ہے
- یکسانیت کا علاج مختلف ادوار کے سگنلوں کو قابل موازنہ بناتا ہے
- حکمت عملی میں خود کار طریقے سے پوزیشن مینجمنٹ کی خصوصیت ہے ، جو نئی پوزیشن کھولنے سے پہلے خود بخود ریورس ہولڈنگ پوزیشنوں کو ختم کردیتی ہے۔
- مارکیٹ کی صورتحال کو سمجھنے میں تاجروں کی مدد کرنے کے لئے عمدہ بصری اثرات
اسٹریٹجک رسک
- ایف وی جی سگنل اعلی اتار چڑھاؤ والے بازاروں میں جعلی سگنل پیدا کرسکتے ہیں
- فکسڈ توثیق پیرامیٹرز تمام مارکیٹ کے حالات پر لاگو نہیں ہوسکتے ہیں
- نقصانات اور روکنے کے لئے کوئی نظام نہیں ہے، جس سے بڑی واپسی کا سبب بن سکتا ہے.
- بار بار ٹرانزیکشنز زیادہ ٹرانزیکشن لاگت کا باعث بن سکتی ہیں
یہ تجویز کی جاتی ہے کہ ان خطرات کا انتظام مناسب اسٹاپ پوزیشنوں کے قیام اور مارکیٹ کے ماحول کے فلٹرز کو متعارف کرانے کے ذریعے کیا جائے۔
حکمت عملی کی اصلاح کی سمت
- خود کار طریقے سے پیرامیٹرز ایڈجسٹمنٹ میکانزم متعارف کرایا تاکہ حکمت عملی مختلف مارکیٹ کے حالات کے مطابق بہتر ہو سکے
- ٹرینڈ فلٹر شامل کریں ، مضبوط رجحانات میں صرف ایک طرفہ تجارت کریں
- زیادہ پیچیدہ گودام مینجمنٹ سسٹم ڈیزائن کریں ، بشمول بیچ اسٹاک اور متحرک اسٹاپ نقصانات
- ٹرانزیکشن لاگت کو مدنظر رکھتے ہوئے ، ٹرانزیکشن کی فریکوئنسی کو بہتر بنائیں
- دیگر تکنیکی اشارے کے ساتھ مل کر سگنل کی وشوسنییتا کو بہتر بنانا
خلاصہ کریں۔
یہ ایک قیمت کی ساخت پر مبنی جدید تجارتی حکمت عملی ہے ، جو منصفانہ قیمت کے فرق کی ذہین شناخت اور توثیق کے ذریعہ مارکیٹ کے مواقع پر قبضہ کرتی ہے۔ حکمت عملی کا ڈیزائن واضح ہے ، اس کو نافذ کرنے کا طریقہ پیشہ ورانہ ہے ، اور اس میں اچھی توسیع پذیری ہے۔ تجویز کردہ اصلاحی سمت کے ذریعہ ، حکمت عملی کی استحکام اور منافع کو مزید فروغ دینے کی امید ہے۔
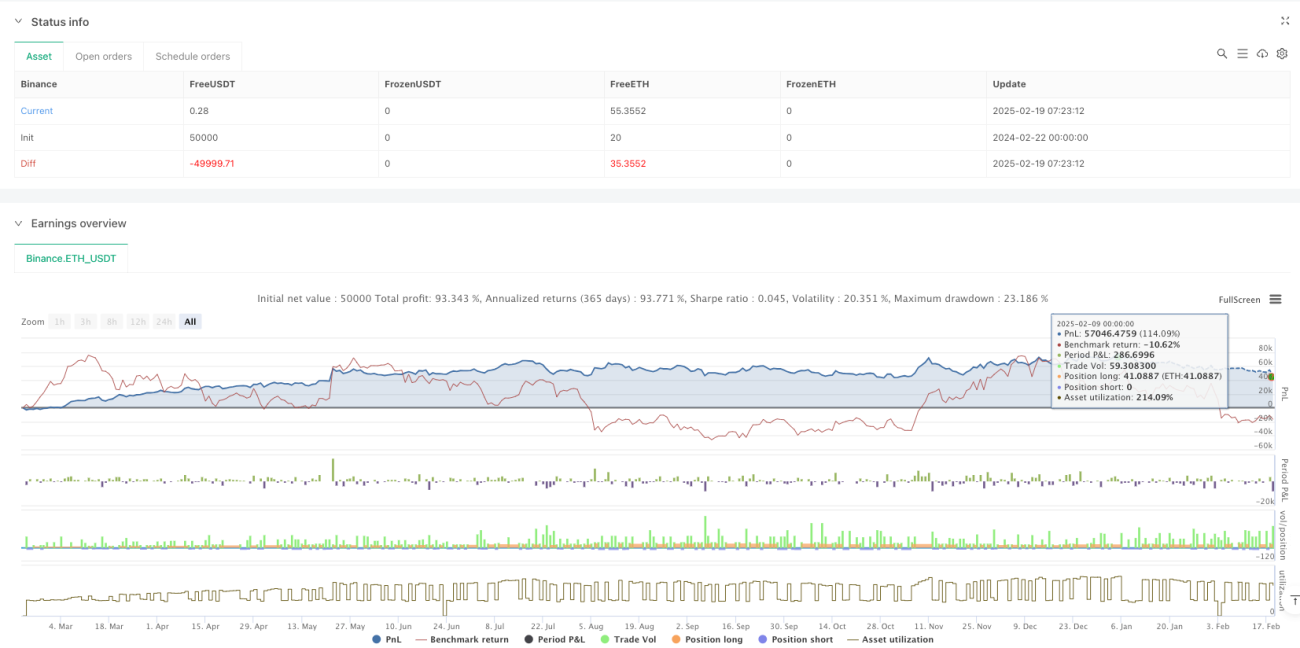
/*backtest
start: 2024-02-22 00:00:00
end: 2025-02-19 08:00:00
period: 1h
basePeriod: 1h
exchanges: [{"eid":"Binance","currency":"ETH_USDT"}]
*/

// ----------------------------------------------------------------------------
// This Pine Script™ code is subject to the terms of the Mozilla Public License
// 2.0 at https://mozilla.org/MPL/2.0/
// © OmegaTools- 1