
جائزہ
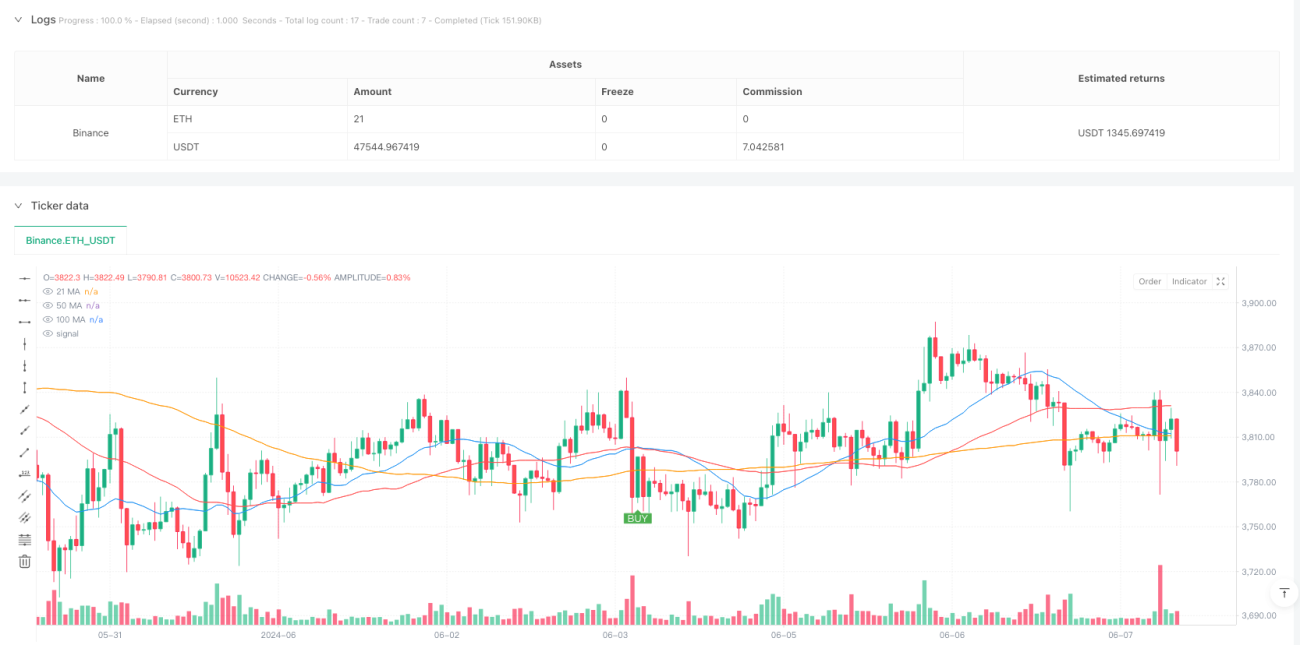
یہ ایک ٹرینڈ ٹریکنگ حکمت عملی ہے جو تین سادہ حرکت پذیر اوسط ((SMA) پر مبنی ہے۔ یہ حکمت عملی مارکیٹ کے رجحانات کی نشاندہی کرنے اور مناسب وقت پر تجارت کرنے کے لئے 21، 50 اور 100 دورانیہ کی حرکت پذیر اوسط کے کراس اور پوزیشن تعلقات کا استعمال کرتی ہے۔ یہ حکمت عملی بنیادی طور پر 5 منٹ کے ٹائم فریم پر چلتی ہے ، جبکہ رجحانات کی تصدیق کے لئے 30 منٹ کے چارٹ کا حوالہ دینے کی سفارش کی جاتی ہے۔
حکمت عملی کا اصول
حکمت عملی ٹریڈنگ سگنل کے تعین کے لئے تین فلٹرنگ میکانزم کا استعمال کرتی ہے:
- مختصر مدت کی قیمتوں میں تبدیلیوں کو پکڑنے کے لئے ایک تیز رفتار اوسط کے طور پر 21 سیکنڈ کی اوسط لائن کا استعمال
- 50 دورانیہ میڈین لائن کو درمیانی میڈین لائن کے طور پر استعمال کرتے ہوئے ، فاسٹ میڈین لائن کے ساتھ کراس سگنل بناتے ہیں
- رجحان فلٹر کے طور پر 100 پیراڈ میڈین لائن کا استعمال کرتے ہوئے ، اس بات کو یقینی بنائیں کہ تجارت کا رخ مرکزی رجحان کے مطابق ہے
خریداری کی شرائط کو ایک ہی وقت میں پورا کیا جانا چاہئے:
- 21 اوسط لائن 50 اوسط لائن کے اوپر سے گزرتا ہے
- 21 اور 50 دونوں 100 کے اوپر ہیں
فروخت کی شرائط کو پورا کرنا ضروری ہے:
- 21 میڈین لائن نیچے 50 میڈین لائن سے گزرتی ہے
- 21 اور 50 دونوں 100 سے نیچے ہیں
اسٹریٹجک فوائد
- ایک سے زیادہ تصدیق کے نظام سے جعلی سگنل کم ہوتے ہیں
- رجحانات کو فلٹر کرنے سے تجارت میں کامیابی کی شرح میں اضافہ ہوتا ہے
- واضح داخلے اور باہر نکلنے کے قواعد
- ایک سے زیادہ ٹائم فریم پر استعمال کیا جا سکتا
- خطرے کی واپسی کا تناسب 1: 2 مقرر کیا گیا ہے ، جو طویل مدتی منافع کے لئے موزوں ہے
- حکمت عملی کی منطق سادہ ہے اور اسے سمجھنے اور اس پر عمل کرنے میں آسانی ہے۔
اسٹریٹجک رسک
- ہلچل مچانے والی مارکیٹیں بار بار تجارت کا سبب بن سکتی ہیں
- اوسط لائن کی تاخیر سے داخلے اور باہر نکلنے میں تاخیر ہوسکتی ہے
- تیز رفتار تبدیلی سے بڑے نقصانات کا خدشہ ہے
- مختلف مارکیٹ کے حالات کے لئے پیرامیٹرز کو ایڈجسٹ کرنے کی ضرورت ہے
رسک کنٹرول کی تجاویز:
- سٹاپ نقصان کی ترتیب قریب ترین اہم کم سے نیچے ہے
- بڑے ٹائم فریم کے ساتھ تصدیق کے رجحانات
- افقی اتار چڑھاؤ والے بازاروں میں تجارت سے گریز کریں
- حکمت عملی کے پیرامیٹرز کا باقاعدگی سے جائزہ لیں اور بہتر بنائیں
حکمت عملی کی اصلاح کی سمت
- ٹرینڈ کی شدت کی تصدیق کے لئے ٹرانزیکشن انڈیکس متعارف کرایا
- متحرک سٹاپ نقصان کا طریقہ کار
- ٹرینڈ سٹرینتھ فلٹر شامل کریں۔
- آپٹمائزنگ پیرامیٹرز کے لئے موافقت کا طریقہ کار
- دیگر تکنیکی اشارے کے ساتھ مل کر سگنل کی تصدیق
- مارکیٹ میں اتار چڑھاؤ کے فلٹرز میں اضافہ
خلاصہ کریں۔
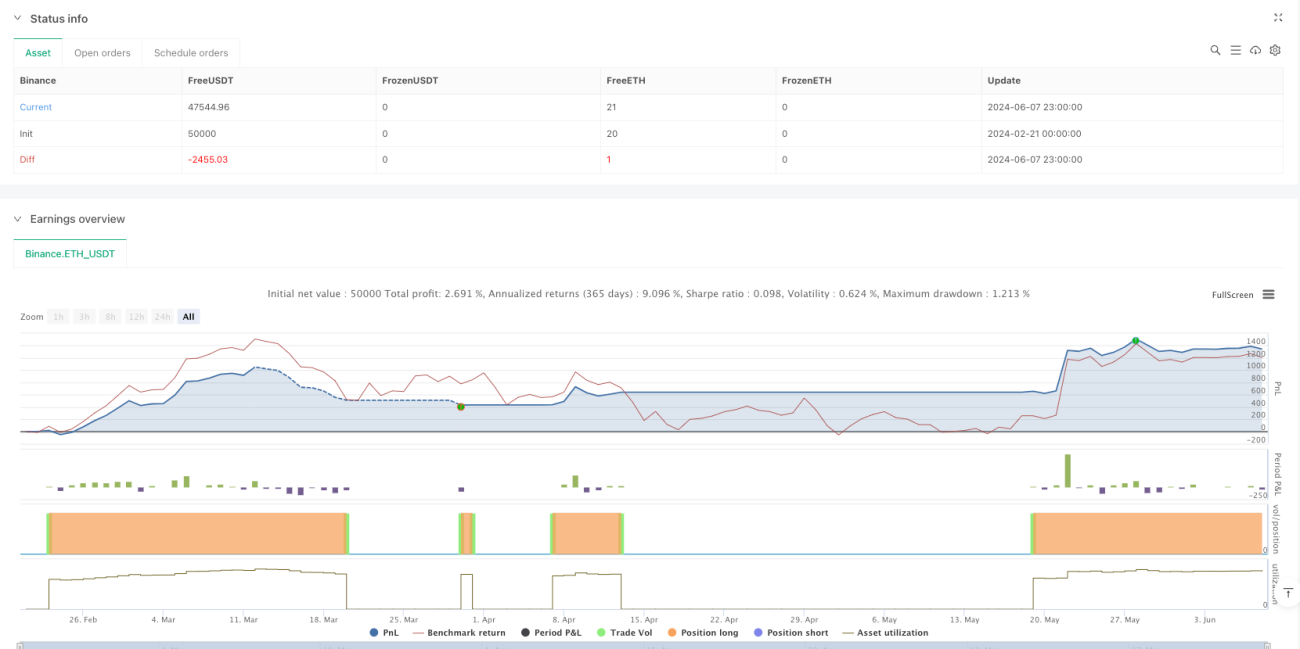
یہ ایک ساختہ ، منطقی اور واضح رجحان کی پیروی کرنے والی حکمت عملی ہے۔ ٹرپل مساوی لائن فلٹرنگ اور رجحان کی تصدیق کے طریقہ کار کے ذریعہ ، یہ جعلی سگنل کو مؤثر طریقے سے کم کرنے اور تجارت کی کامیابی کی شرح کو بڑھانے کے قابل ہے۔ حکمت عملی میں اچھی توسیع ہے ، جس کو مختلف مارکیٹ کے حالات کے مطابق بہتر بنانے کے لئے ایڈجسٹ کیا جاسکتا ہے۔
/*backtest
start: 2024-02-21 00:00:00
end: 2024-06-08 00:00:00
period: 1h
basePeriod: 1h
exchanges: [{"eid":"Binance","currency":"ETH_USDT"}]
*/

// This Pine Script™ code is subject to the terms of the Mozilla Public License 2.0 at https://mozilla.org/MPL/2.0/
// © Vezpa
//@version=5
strategy("Vezpa's Gold Strategy", overlay=true)- 1