متعدد K-لائن پیٹرن پر مبنی ٹرپل اسٹرائیک مقداری تجارتی حکمت عملی

TLS ECS K-LINE MA PATTERN Trend momentum
تخلیق کی تاریخ: 2025-02-21 11:00:33 آخر میں ترمیم کریں: 2025-02-27 17:12:20
کاپی: 1 کلکس کی تعداد: 382
2
پر توجہ دیں
319
پیروکار

متعدد K-لائن پیٹرن پر مبنی ٹرپل اسٹرائیک مقداری تجارتی حکمت عملی متعدد K-لائن پیٹرن پر مبنی ٹرپل اسٹرائیک مقداری تجارتی حکمت عملی

جائزہ

یہ ایک مقداری تجارتی حکمت عملی ہے جو تین لائن ہڑتال اور نگلنے والے پیٹرن پر مبنی ہے۔ یہ حکمت عملی مارکیٹ کے رجحان کے موڑ کو پکڑنے کے ل three تین مسلسل K لائن پیٹرن کے بعد ایک اہم الٹ K لائن کی نشاندہی کرتی ہے اور متعدد تکنیکی اشارے کے ساتھ مل کر تجارتی فیصلے کرتی ہے۔ اس حکمت عملی میں سگنل کی شناخت کا ایک مکمل نظام اور رسک کنٹرول میکانزم ڈیزائن کیا گیا ہے اور یہ انتہائی مرضی کے مطابق پیرامیٹرز کی ترتیبات فراہم کرتا ہے۔

حکمت عملی کا اصول

اس حکمت عملی کی بنیادی منطق دو اہم K لائن شکلوں پر مبنی ہے:

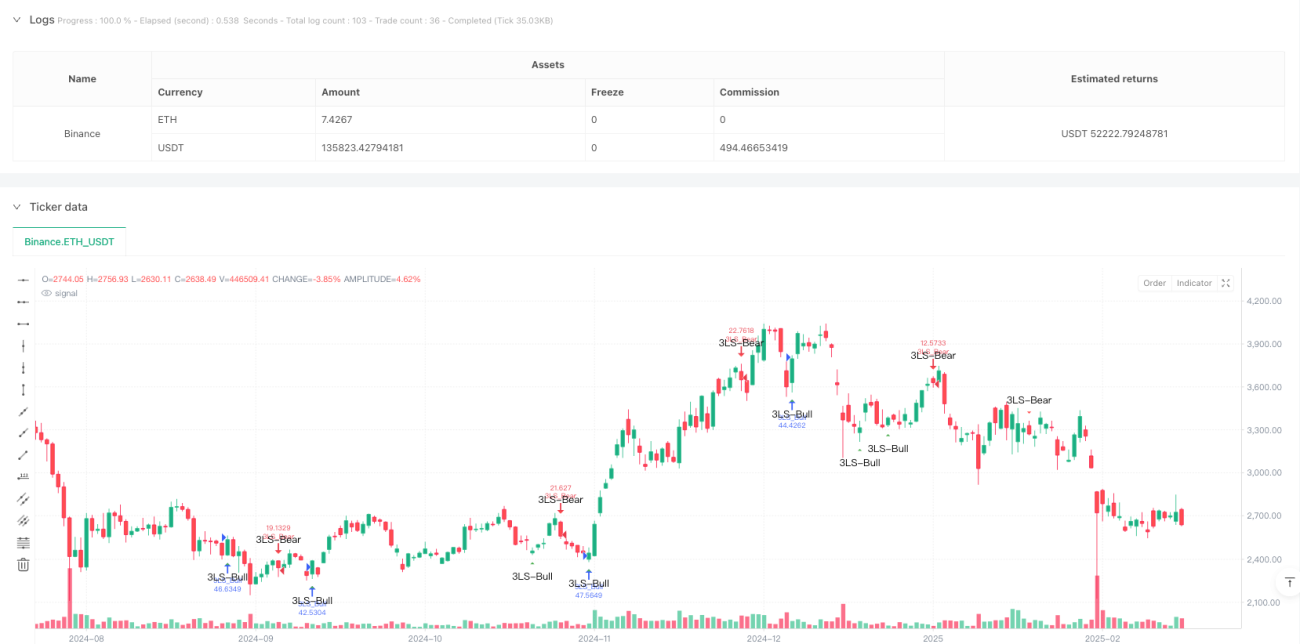
  1. ٹرپل ہٹ شکل: مسلسل تین ہم آہنگ K لائنوں کے بعد الٹ K لائنوں کی نشاندہی کرکے رجحان کی الٹ کا فیصلہ کریں۔ اچھال کی شکل تین مسلسل گرنے والی سرخ K لائنوں کے بعد ایک بڑی سبز نگلنے والی K لائن پر مشتمل ہے۔
  2. نگلنے والی شکلیں: انفرادی طور پر بڑے پیمانے پر نگلنے والی K لائن بھی معاون سگنل کے طور پر کام کرتی ہے۔ حکمت عملی کے مطابق موجودہ K لائن کو پچھلی K لائن کے جسمانی سائز کے ساتھ موازنہ کرکے نگلنے والی شکلوں کی شناخت کی جاتی ہے۔

اسٹریٹجک فوائد

  1. سگنل کی شناخت درست ہے: حکمت عملی سخت ریاضی کے حساب سے K لائن کی شکل کا تعین کرتی ہے ، جس میں متعدد شرائط فلٹرنگ کے ذریعہ سگنل کے معیار کو یقینی بنایا جاتا ہے۔
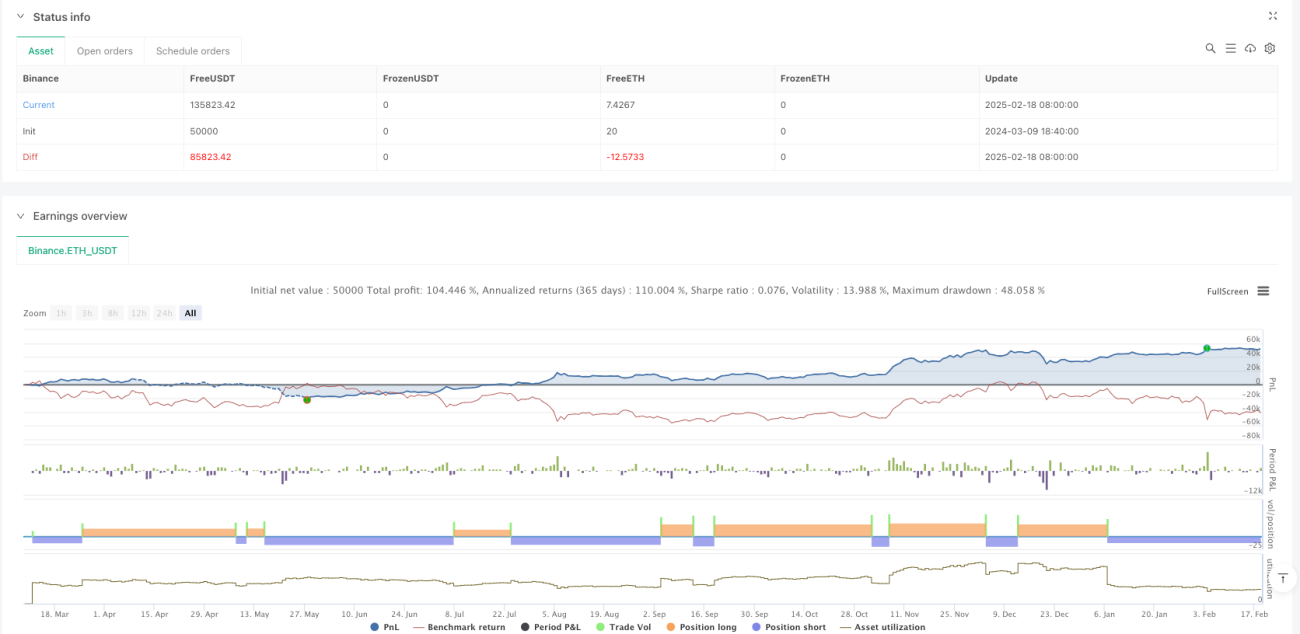
  2. خطرے پر قابو پانا: ابتدائی فنڈ ، پوزیشن تناسب جیسے خطرے کے پیرامیٹرز مرتب کیے گئے ہیں ، اور دوبارہ داخلے پر پابندی عائد کردی گئی ہے۔
  3. اونچائی حسب ضرورت: مارکیٹ کی مختلف خصوصیات اور تجارتی ضروریات کے مطابق بہتر بنانے کے لئے وسیع پیمانے پر پیرامیٹرز کی ترتیبات فراہم کی جاتی ہیں۔
  4. بصری معاونت: تجزیہ اور نگرانی کے لئے واضح گرافک لیبلنگ اور اشارے فراہم کرتا ہے۔

اسٹریٹجک رسک

  1. مارکیٹ کے ماحول پر انحصار: ہلکے بازاروں میں بہت زیادہ جعلی سگنل پیدا ہوسکتے ہیں۔
  2. سلائڈ پوائنٹ اثر: بڑے ڈوبنے والے K لائنوں کے داخلے کے مقامات پر زیادہ سلائڈ پوائنٹ اثر پڑ سکتا ہے۔
  3. تاخیر کا خطرہ: شکل کی شناخت کے لئے کئی K لائنوں کی ضرورت ہوتی ہے ، جس سے بہترین داخلے کا وقت ضائع ہوسکتا ہے۔

حکمت عملی کی اصلاح کی سمت

  1. ٹرانزٹ کی پیمائش کا تعارف: ٹرانزٹ کی تبدیلیوں کو جوڑ کر سگنل کے معیار کو فلٹر کریں۔
  2. اسٹاپ نقصان کی اصلاح کی ترتیبات: اے ٹی آر یا اتار چڑھاؤ کی شرح پر مبنی اسٹاپ نقصان کی پوزیشن کو متحرک طور پر ایڈجسٹ کریں۔
  3. رجحان فلٹر شامل کریں: مجموعی رجحانات کا فیصلہ کرنے کے لئے ایک مساوی نظام شامل کریں۔
  4. بہتر انخلا کے طریقہ کار: زیادہ لچکدار منافع کے لئے ڈیزائن کیا گیا

خلاصہ کریں۔

اس حکمت عملی میں مارکیٹ کے اہم موڑ کو پکڑنے کے لئے ایک منظم تکنیکی تجزیہ کا طریقہ استعمال کیا جاتا ہے ، جس میں ایک مضبوط نظریاتی بنیاد اور عملی قدر ہے۔ پیرامیٹرز کی اصلاح اور خطرے کے کنٹرول کو بہتر بنانے کے ذریعہ ، یہ ایک مستحکم تجارتی نظام کا ایک اہم جزو ہوسکتا ہے۔ حکمت عملی کا ماڈیولر ڈیزائن بھی مزید اصلاحات کے لئے ایک اچھی بنیاد فراہم کرتا ہے۔

Overview

This is a quantitative trading strategy based on Three Line Strike and Engulfing patterns. The strategy captures market turning points by identifying breakthrough reversal candlesticks following three consecutive candles, combining multiple technical indicators for trading decisions. It features a complete signal detection system and risk control mechanism, with highly customizable parameter settings.

Strategy Principle

The core logic is based on two main candlestick patterns:

  1. Three Line Strike Pattern: Identifies trend reversals through three consecutive same-direction candles followed by a reversal candle. Bullish pattern consists of three consecutive red candles followed by a large green engulfing candle; bearish pattern consists of three consecutive green candles followed by a large red engulfing candle.
  2. Engulfing Pattern: Large single engulfing candles serve as auxiliary signals. The strategy identifies engulfing patterns by comparing the body size of current and previous candles.

Strategy Advantages

  1. Precise Signal Identification: Uses strict mathematical calculations to judge candlestick patterns, ensuring signal quality through multiple condition filtering.
  2. Comprehensive Risk Control: Includes risk parameters like initial capital and position sizing, with pyramiding prevention.
  3. Highly Customizable: Offers rich parameter settings for optimization according to different market characteristics and trading needs.
  4. Visual Support: Provides clear graphical markers and alert messages for analysis and monitoring.

Strategy Risks

  1. Market Environment Dependency: May generate excessive false signals in ranging markets.
  2. Slippage Impact: Entry points for large engulfing candles may be subject to significant slippage.
  3. Delay Risk: Pattern recognition requires multiple candles, potentially missing optimal entry points.

Optimization Directions

  1. Incorporate Volume Indicators: Filter signal quality by combining volume changes.
  2. Optimize Stop Loss Settings: Dynamically adjust stop loss positions based on ATR or volatility.
  3. Add Trend Filtering: Implement moving average systems to judge overall trend.
  4. Improve Exit Mechanism: Design more flexible profit-taking conditions.

Summary

The strategy captures important market turning points through systematic technical analysis, with strong theoretical foundation and practical value. Through parameter optimization and risk control refinement, it can serve as an important component of a robust trading system. The modular design also provides a good foundation for further optimization.

حکمت عملی کا ماخذ کوڈ
/*backtest
start: 2024-03-09 18:40:00
end: 2025-02-19 08:00:00
period: 1d
basePeriod: 1d
exchanges: [{"eid":"Binance","currency":"ETH_USDT"}]
*/

// Copyright ...
// Based on the TMA Overlay by Arty, converted to a simple strategy example.
// Pine Script v5

//@version=5
strategy(title='3 Line Strike [TTF] - Strategy',
     shorttitle='3LS Strategy [TTF]',
     overlay=true,
     initial_capital=100000,
     default_qty_type=strategy.percent_of_equity,
     default_qty_value=100,
     pyramiding=0)

// -----------------------------------------------------------------------------
//                               INPUTS
// -----------------------------------------------------------------------------

//
// ### 3 Line Strike
//
showBear3LS = input.bool(title='Show Bearish 3 Line Strike', defval=true, group='3 Line Strike',
     tooltip="Bearish 3 Line Strike (3LS-Bear) = 3 green candles followed by a large red candle (engulfing).")
showBull3LS = input.bool(title='Show Bullish 3 Line Strike', defval=true, group='3 Line Strike',
     tooltip="Bullish 3 Line Strike (3LS-Bull) = 3 red candles followed by a large green candle (engulfing).")
showMemeChars = input.bool(title="Plot 3 Line Strike meme symbols", defval=false, group="3 Line Strike")

//
//### Engulfing Candles
//
showBearEngulfing= input.bool(title='Show Bearish Big Candles', defval=false, group='Big Candles')
showBullEngulfing= input.bool(title='Show Bullish Big Candles', defval=false, group='Big Candles')

//
//### Alerts
//
void = input.bool(title="(Info) Alerts are based on detected signals.", defval=true)

// -----------------------------------------------------------------------------
//                          HELPER FUNCTIONS
// -----------------------------------------------------------------------------

// Function: Get the 'color' of the candle: -1 = red, 0 = doji, +1 = green
getCandleColorIndex(barIndex) =>
    int ret = na
    if (close[barIndex] > open[barIndex])
        ret := 1
    else if (close[barIndex] < open[barIndex])
        ret := -1
    else
        ret := 0
    ret

// Function: Check if the candle is engulfing (based on the body size of the candles)
isEngulfing(checkBearish) =>
    // Size of the previous candle
    sizePrevCandle = close[1] - open[1]
    // Size of the current candle
    sizeCurrentCandle = close - open
    isCurrentLargerThanPrevious = math.abs(sizeCurrentCandle) > math.abs(sizePrevCandle)
    
    // Bearish / Bullish division
    if checkBearish
        // Bearish engulfing: previous green, current larger red
        isGreenToRed = (getCandleColorIndex(0) < 0) and (getCandleColorIndex(1) > 0)
        isCurrentLargerThanPrevious and isGreenToRed
    else
        // Bullish engulfing: previous red, current larger green
        isRedToGreen = (getCandleColorIndex(0) > 0) and (getCandleColorIndex(1) < 0)
        isCurrentLargerThanPrevious and isRedToGreen

// Simplified calls for bullish/bearish engulfing
isBearishEngulfing() => isEngulfing(true)
isBullishEngulfing() => isEngulfing(false)

// Function: 3 consecutive candles of one color followed by the opposite engulfing candle
// 3 Line Strike - Bearish
is3LSBear() =>
    // Three consecutive green candles?
    is3LineSetup = (getCandleColorIndex(1) > 0) and (getCandleColorIndex(2) > 0) and (getCandleColorIndex(3) > 0)
    // Followed by Bearish engulfing
    is3LineSetup and isBearishEngulfing()

// 3 Line Strike - Bullish
is3LSBull() =>
    // Three consecutive red candles?
    is3LineSetup = (getCandleColorIndex(1) < 0) and (getCandleColorIndex(2) < 0) and (getCandleColorIndex(3) < 0)
    // Followed by Bullish engulfing
    is3LineSetup and isBullishEngulfing()

// -----------------------------------------------------------------------------
//                             SIGNALS
// -----------------------------------------------------------------------------

// ### 3 Line Strike
is3LSBearSig = is3LSBear()
is3LSBullSig = is3LSBull()

// Meme icons vs. standard shapes
plotchar(showBull3LS and showMemeChars ? is3LSBullSig : na, char="🍆", color=color.rgb(0, 255, 0, 0),
         location=location.belowbar, size=size.tiny, text='3LS-Bull', title='3 Line Strike Up (Meme Icon)', editable=false)
plotchar(showBear3LS and showMemeChars ? is3LSBearSig : na, char="🍑", color=color.rgb(255, 0, 0, 0),
         location=location.abovebar, size=size.tiny, text='3LS-Bear', title='3 Line Strike Down (Meme Icon)', editable=false)

plotshape(showBull3LS and not showMemeChars ? is3LSBullSig : na, style=shape.triangleup,
         color=color.green, location=location.belowbar, size=size.small, text='3LS-Bull', title='3 Line Strike Up')
plotshape(showBear3LS and not showMemeChars ? is3LSBearSig : na, style=shape.triangledown,
         color=color.red, location=location.abovebar, size=size.small, text='3LS-Bear', title='3 Line Strike Down')

// ### Engulfing Candles
isBullEngulfingSig = isBullishEngulfing()
isBearEngulfingSig = isBearishEngulfing()

plotshape(showBullEngulfing ? isBullEngulfingSig : na, style=shape.triangleup,
         location=location.belowbar, color=color.new(color.green,0), size=size.tiny, title='Big Candle Up')
plotshape(showBearEngulfing ? isBearEngulfingSig : na, style=shape.triangledown,
         location=location.abovebar, color=color.new(color.red,0), size=size.tiny, title='Big Candle Down')

// -----------------------------------------------------------------------------
//                               ALERTS
// -----------------------------------------------------------------------------

// 3LS - "Old" alertcondition + "New" alert() (based on what people use)
alertcondition(showBull3LS and is3LSBullSig, title='Bullish 3 Line Strike',
     message='{{exchange}}:{{ticker}} {{interval}} - Bullish 3 Line Strike')
alertcondition(showBear3LS and is3LSBearSig, title='Bearish 3 Line Strike',
     message='{{exchange}}:{{ticker}} {{interval}} - Bearish 3 Line Strike')

if (showBull3LS and is3LSBullSig)
    m = syminfo.tickerid + ' ' + timeframe.period + ' - Bullish 3 Line Strike'
    alert(message=str.tostring(m), freq=alert.freq_once_per_bar_close)

if (showBear3LS and is3LSBearSig)
    m = syminfo.tickerid + ' ' + timeframe.period + ' - Bearish 3 Line Strike'
    alert(message=str.tostring(m), freq=alert.freq_once_per_bar_close)

// Engulfing - "Old" alertcondition + "New" alert()
alertcondition(showBullEngulfing and isBullEngulfingSig, title='Bullish Engulfing',
     message='{{exchange}}:{{ticker}} {{interval}} - Bullish candle engulfing previous candle')
alertcondition(showBearEngulfing and isBearEngulfingSig, title='Bearish Engulfing',
     message='{{exchange}}:{{ticker}} {{interval}} - Bearish candle engulfing previous candle')

if (showBullEngulfing and isBullEngulfingSig)
    m = syminfo.tickerid + ' ' + timeframe.period + ' - Bullish candle engulfing previous candle'
    alert(message=str.tostring(m), freq=alert.freq_once_per_bar_close)

if (showBearEngulfing and isBearEngulfingSig)
    m = syminfo.tickerid + ' ' + timeframe.period + ' - Bearish candle engulfing previous candle'
    alert(message=str.tostring(m), freq=alert.freq_once_per_bar_close)

// -----------------------------------------------------------------------------
//                          STRATEGY ENTRY ORDERS
// -----------------------------------------------------------------------------
//
// Logic for entering trades. If display is enabled and a signal is detected, a trade will be entered.
//
// 3 Line Strike
if (showBull3LS and is3LSBullSig)
    strategy.entry("3LS_Bull", strategy.long, comment="3LS Bullish")

if (showBear3LS and is3LSBearSig)
    strategy.entry("3LS_Bear", strategy.short, comment="3LS Bearish")

// Engulfing
if (showBullEngulfing and isBullEngulfingSig)
    strategy.entry("BullEngulf", strategy.long, comment="Bullish Engulfing")

if (showBearEngulfing and isBearEngulfingSig)
    strategy.entry("BearEngulf", strategy.short, comment="Bearish Engulfing")

//
// End of script