
جائزہ
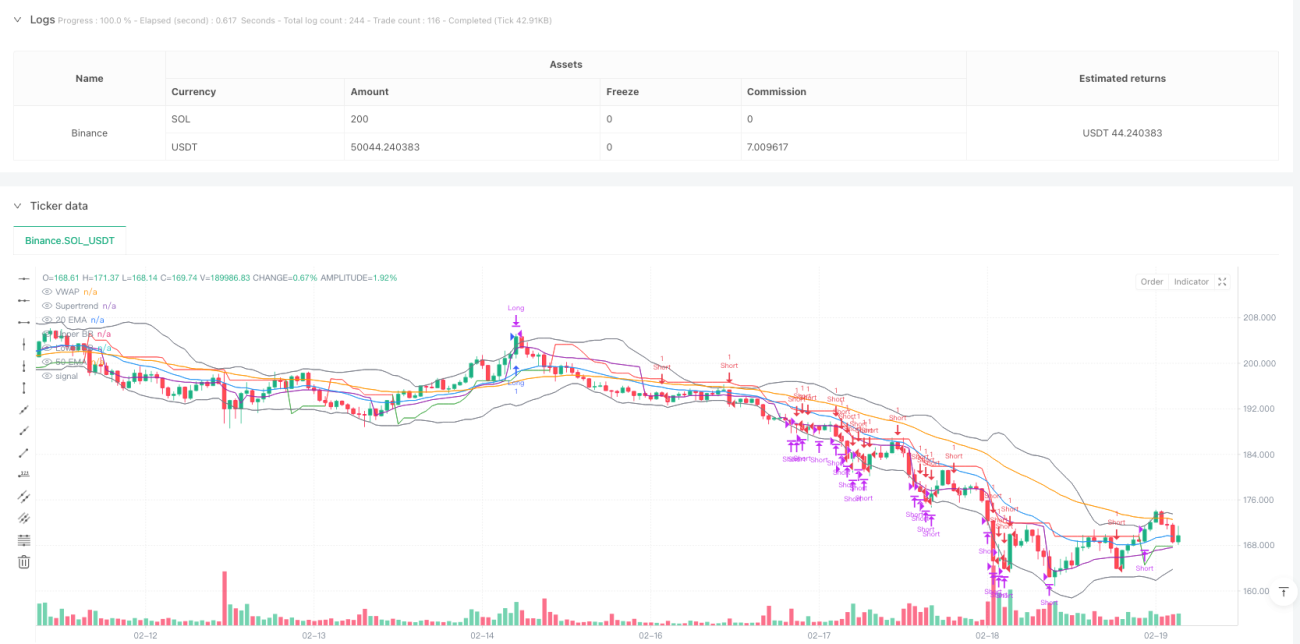
یہ حکمت عملی رجحانات کی پیروی اور وقفے وقفے سے تجارت کے ساتھ مل کر ایک خود کار طریقے سے ٹریڈنگ سسٹم ہے۔ یہ متعدد تکنیکی اشارے کے ہم آہنگی کے ساتھ کام کرتا ہے ، مختلف مارکیٹ کے ماحول میں لچکدار تجارت کے موڈ کو تبدیل کرتا ہے۔ حکمت عملی مارکیٹ کی حالت کی شناخت اور تجارتی سگنل کی نشاندہی کرنے کے لئے سپر ٹرینڈ ، موبائل میڈ لائن ، ADX ، RSI اور برلن بینڈ جیسے اشارے کا استعمال کرتی ہے ، جبکہ VWAP کے ساتھ قیمت کا حوالہ دیا جاتا ہے ، اور خطرے کو کنٹرول کرنے کے لئے اسٹاپ نقصان کا طریقہ کار ترتیب دیا گیا ہے۔
حکمت عملی کا اصول
حکمت عملی کے بنیادی منطق کو دو حصوں میں تقسیم کیا گیا ہے: رجحانات کی پیروی اور وقفے سے تجارت کرنا۔ رجحانات کی منڈیوں میں ((ADX> 25 کی طرف سے فیصلہ کیا جاتا ہے) ، حکمت عملی سپر ٹرینڈ کی سمت ، EMA کراسنگ اور VWAP پوزیشن پر مبنی سگنل پیدا کرتی ہے۔ چونکانے والی منڈیوں میں ، حکمت عملی بروئنگ بینڈ کی سرحد اور RSI سے زیادہ خرید و فروخت کی سطح پر تجارت کرتی ہے۔ خاص طور پر:
- ٹرینڈ ٹریک موڈ: جب ADX> 25 پر فعال ہوتا ہے تو ، 20/50 دورانیہ EMA کی پوزیشن تعلقات ، سپر ٹرینڈ کی سمت اور قیمت کے مقابلے میں VWAP کی پوزیشن کا جامع فیصلہ
- بینڈ ٹریڈنگ موڈ: جب ADX <25 پر چالو ہوجاتا ہے تو ، جب قیمت بلینز کی حد کو چھوتی ہے اور آر ایس آئی انتہائی حد تک پہنچ جاتی ہے تو اس میں داخل ہوجاتا ہے
- باہر نکلنے کی شرائط میں شامل ہیں: اسٹاپ نقصان کا ٹرگر ، سپر ٹرینڈ الٹ یا RSI انتہائی حد تک پہنچ گیا
اسٹریٹجک فوائد
- لچکدار: مارکیٹ کی حالت کے مطابق ٹریڈنگ کے طریقوں کو خود بخود تبدیل کرنے کی صلاحیت
- ایک سے زیادہ تصدیق: سگنل کی وشوسنییتا کو بہتر بنانے کے لئے ایک سے زیادہ اشارے کے ساتھ کراس تصدیق
- خطرہ کنٹرول میں بہتری: ایک مقررہ فیصد سٹاپ نقصان مقرر کیا گیا ہے اور RSI کی انتہائی قیمتوں کا استعمال کرتے ہوئے متحرک ایڈجسٹمنٹ
- جامع: رجحانات پر قابو پانے کے ساتھ ساتھ اتار چڑھاؤ والے بازاروں میں منافع کمانے کے قابل
- بصری معاونت: اہم اشارے کے گرافک ڈسپلے فراہم کرتے ہیں تاکہ فیصلہ سازی میں مدد مل سکے
اسٹریٹجک رسک
- پیرامیٹر حساسیت: ایک سے زیادہ اشارے پیرامیٹرز کی ترتیبات پالیسی کی کارکردگی کو متاثر کرتی ہیں
- سگنل کی تاخیر: تکنیکی اشارے خود ہی پیچھے رہ گئے ہیں
- جعلی بریک کا خطرہ: افقی مارکیٹوں میں جعلی سگنل پیدا ہو سکتے ہیں
- کمپیوٹنگ کی پیچیدگی: متعدد اشارے کا اصل وقت کا حساب کتاب کارکردگی پر اثر انداز ہوسکتا ہے
- مارکیٹ کی موافقت: کچھ مخصوص مارکیٹ کے حالات میں خراب کارکردگی کا مظاہرہ کرسکتا ہے
حکمت عملی کی اصلاح کی سمت
- متحرک پیرامیٹرز ایڈجسٹمنٹ: ہر اشارے کے پیرامیٹرز کو اتار چڑھاؤ کی شرح کے مطابق خود بخود ایڈجسٹ کیا جاسکتا ہے
- ٹرانزٹ تجزیہ متعارف کرایا: سگنل کی تاثیر کی توثیق کرنے کے لئے ٹرانزٹ کی پیمائش میں اضافہ
- نقصانات کو روکنے کے طریقہ کار کو بہتر بنانا: اے ٹی آر متحرک نقصان کو روکنے کے بارے میں غور کریں
- ٹائم فلٹر شامل کریں: غیر موثر اوقات سے بچنے کے لئے ٹرانزیکشن ٹائم ونڈوز شامل کریں
- مارکیٹ کے جذبات کے اشارے: پیشن گوئی کی درستگی کو بہتر بنانے کے لئے مارکیٹ کے جذبات کے اشارے کو مربوط کرنا
خلاصہ کریں۔
یہ ایک جامع حکمت عملی ہے جو معقول اور منطقی طور پر ڈیزائن کی گئی ہے۔ مختلف مارکیٹ کے حالات میں متعدد اشارے کے تعاون اور موڈل سوئچنگ کے ذریعہ کچھ موافقت برقرار رکھی جاسکتی ہے۔ اگرچہ کچھ ممکنہ خطرات موجود ہیں ، لیکن معقول خطرے پر قابو پانے اور مسلسل اصلاح کے ذریعہ ، اس حکمت عملی میں عملی استعمال کی اچھی قدر ہے۔ عملی استعمال کے وقت مناسب پیرامیٹرز کی اصلاح اور جانچ پڑتال کی سفارش کی جاتی ہے۔
- 1