کثیر اشاریوں کا انضمامی خودکار موافق رجحان تجارتی حکمت عملی

جائزہ
یہ حکمت عملی ایک انکولی رجحان ٹریکنگ ٹریڈنگ سسٹم ہے جو کئی تکنیکی اشاریوں کو یکجا کرتی ہے۔ اس میں اوسط حرکت پذیری کے نظام (EMA)، مومینٹم انڈیکیٹر (RSI)، رجحان انڈیکیٹر (MACD) اور SuperTrend سگنل کی تصدیق کے لیے شامل ہیں، اور اس میں رسک مینجمنٹ کے مکمل میکانزم بھی شامل ہیں جن میں سٹاپ لاس، ٹیک پرافٹ اور ٹریلنگ سٹاپ شامل ہیں۔ حکمت عملی مارکیٹ کے اتار چڑھاؤ کو مدنظر رکھتے ہوئے ڈیزائن کی گئی ہے، اور متعدد سگنل فلٹریشن اور رسک کنٹرول کے ذریعے ٹریڈنگ کے استحکام اور اعتماد کو بہتر بنایا گیا ہے۔
حکمت عملی کے اصول
حکمت عملی کثیر سطحی سگنل تصدیق کے میکانزم پر مشتمل ہے:
- 9 اور 21 دورانیے کے EMA کے کراس اوور سے ابتدائی رجحان کی سمت کا تعین
- RSI (14) کو اوور باؤٹ/اوور سولڈ فلٹرنگ کے لیے استعمال کرنا، خرید کے سگنل کے لیے RSI>40 اور <70 کی شرط، فروخت کے سگنل کے لیے RSI<60 اور >30 کی شرط
- MACD انڈیکیٹر رجحانی قوت کی تصدیق کرتا ہے، جس کے لیے سگنل لائن اور MACD لائن کی سمت ایک جیسی ہونی چاہیے
- SuperTrend انڈیکیٹر اضافی رجحانی تصدیق فراہم کرتا ہے
- رسک کنٹرول 5% سٹاپ لاس، 10% ٹیک پرافٹ، 2% ٹریلنگ سٹاپ اور 1% بریک ایون پوائنٹ پر مشتمل ہے
جب تمام شرائط بیک وقت پوری ہوتی ہیں تبھی ٹریڈ سگنل متحرک ہوتا ہے، جس سے جھوٹے بریک آؤٹ کا خطرہ کم ہو جاتا ہے۔
حکمت عملی کے فوائد
- کثیر سگنل تصدیق کا میکانزم جھوٹے سگنلز کی مداخلت کو نمایاں طور پر کم کرتا ہے
- رسک کنٹرول کا مکمل نظام، جس میں مقررہ سٹاپ لاس، ٹریلنگ سٹاپ اور بریک ایون سٹاپ شامل ہیں
- حکمت عملی میں اچھی انکولی صلاحیت ہے، جو مختلف مارکیٹ حالات کے مطابق ڈھل سکتی ہے
- داخلے اور خارج ہونے کی منطق واضح ہے، جسے سمجھنا اور برقرار رکھنا آسان ہے
- ٹریڈنگ منطق کی مضبوط نظریاتی بنیاد ہے، اور ہر انڈیکیٹر کا ایک مخصوص کردار ہے
حکمت عملی کے خطرات
- کثیر سطحی سگنل تصدیق کی وجہ سے کچھ اہم ٹریڈنگ مواقعوں سے محروم ہونے کا امکان
- شدید اتار چڑھاؤ والی مارکیٹ میں، مقررہ سٹاپ لاس پوزیشنیں کافی لچکدار نہیں ہو سکتیں
- پیرامیٹر آپٹیمائزیشن تاریخی ڈیٹا پر اوور فٹنگ کا سبب بن سکتی ہے
- متعدد انڈیکیٹرز رینج والی مارکیٹ میں متضاد سگنلز پیدا کر سکتے ہیں
حل میں شامل ہیں: سٹاپ لاس پیرامیٹرز کو متحرک طور پر ایڈجسٹ کرنا، اتار چڑھاؤ کے انڈیکیٹر متعارف کرانا، اور باقاعدگی سے پیرامیٹرز کو دوبارہ بہتر بنانا۔
حکمت عملی کی بہتری کے ممکنہ راستے
- انکولی پیرامیٹر میکانزم متعارف کرانا، مارکیٹ کے اتار چڑھاؤ کے مطابق مختلف پیرامیٹرز کو متحرک طور پر ایڈجسٹ کرنا
- حجم کے انڈیکیٹر کو معاون تصدیقی آلے کے طور پر شامل کرنا
- سٹاپ لاس میکانزم کو بہتر بنانا، ATR پر مبنی متحرک سٹاپ لاس متعارف کرانا
- مارکیٹ کے ماحول کی شناخت کا ماڈیول شامل کرنا، مختلف مارکیٹ حالات میں مختلف پیرامیٹر سیٹ استعمال کرنا
- مشین لرننگ پر مبنی پیرامیٹر آپٹیمائزیشن سسٹم تیار کرنا
خلاصہ
یہ حکمت عملی کثیر جہتی تکنیکی اشاریوں کے ہم آہنگی کے ذریعے ایک مضبوط ٹریڈنگ سسٹم تشکیل دیتی ہے۔ رسک کنٹرول کا مکمل نظام اور واضح ٹریڈنگ منطق اسے عملی طور پر کارآمد بناتے ہیں۔ اگرچہ بہتری کی گنجائش موجود ہے، لیکن حکمت عملی کے بنیادی ڈھانچے کی مضبوط نظریاتی بنیاد ہے، اور مسلسل بہتری اور ترقی کے ذریعے اس کی ٹریڈنگ کارکردگی کو مزید بڑھایا جا سکتا ہے۔
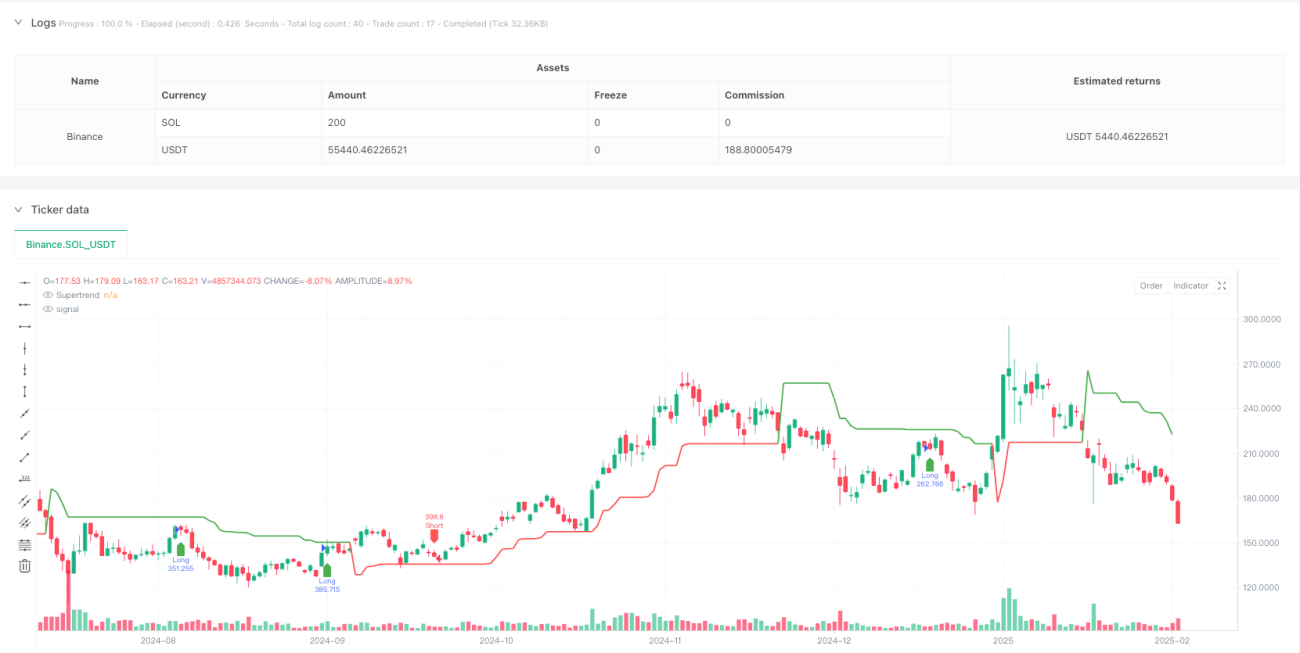
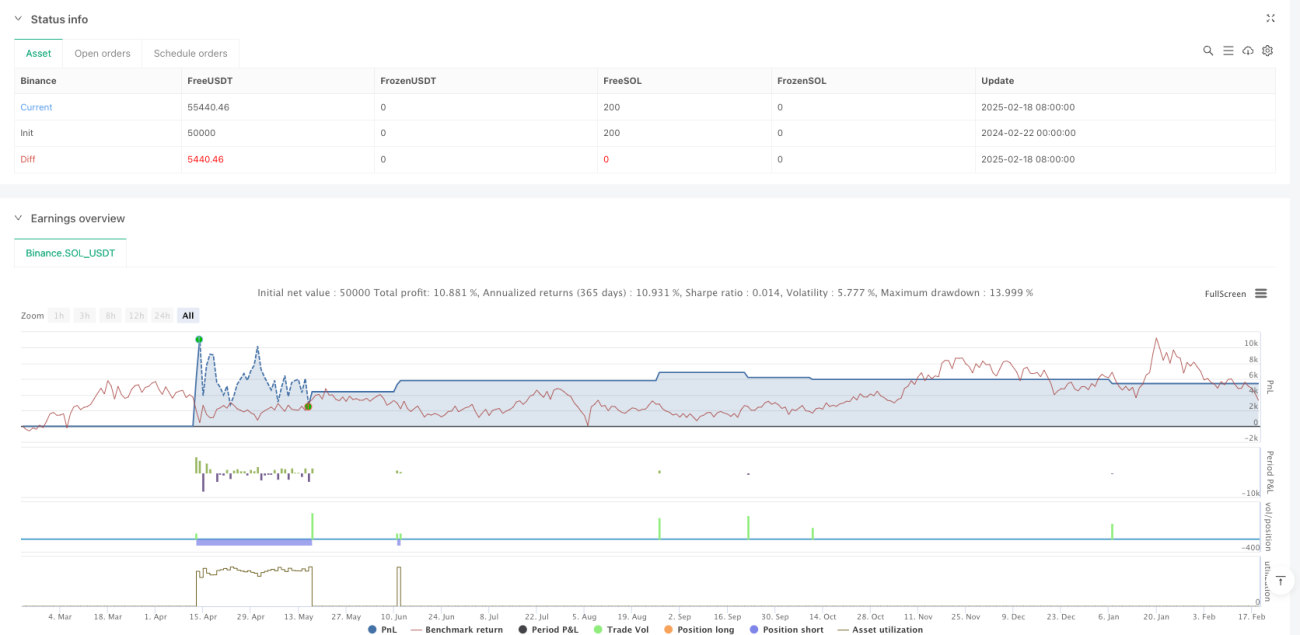
/*backtest
start: 2024-02-22 00:00:00
end: 2025-02-19 08:00:00
period: 1d
basePeriod: 1d
exchanges: [{"eid":"Binance","currency":"SOL_USDT"}]
*/

//@version=5
strategy("Optimized BTC Trading Strategy v2", overlay=true, default_qty_type=strategy.percent_of_equity, default_qty_value=100, commission_type=strategy.commission.percent, commission_value=0.1)

// Input parameters- 1