
جائزہ
یہ حکمت عملی ڈونچین چینل پر مبنی ٹرینڈ ٹریکنگ ٹریڈنگ سسٹم ہے جس میں سپر ٹرینڈ اشارے اور ٹرانزیکشن فلٹرز شامل ہیں جو تجارتی سگنل کی وشوسنییتا کو بڑھا دیتے ہیں۔ یہ حکمت عملی بنیادی طور پر قیمتوں کی تاریخی اونچائیوں کو توڑنے کے ذریعہ ممکنہ کثیر جہتی تجارتی مواقع کی نشاندہی کرتی ہے ، جبکہ ٹرانزیکشن کی تصدیق اور ٹرینڈ ٹریکنگ اشارے کا استعمال جعلی ٹرانزیکشن سگنل کو فلٹر کرنے کے لئے کیا جاتا ہے۔ حکمت عملی کا ڈیزائن لچکدار ہے ، جس کو مختلف مارکیٹ کے حالات اور تجارتی اقسام کے مطابق پیرامیٹرز کے مطابق بہتر بنایا جاسکتا ہے۔
حکمت عملی کا اصول
حکمت عملی کی بنیادی منطق درج ذیل کلیدی اجزاء پر مبنی ہے:
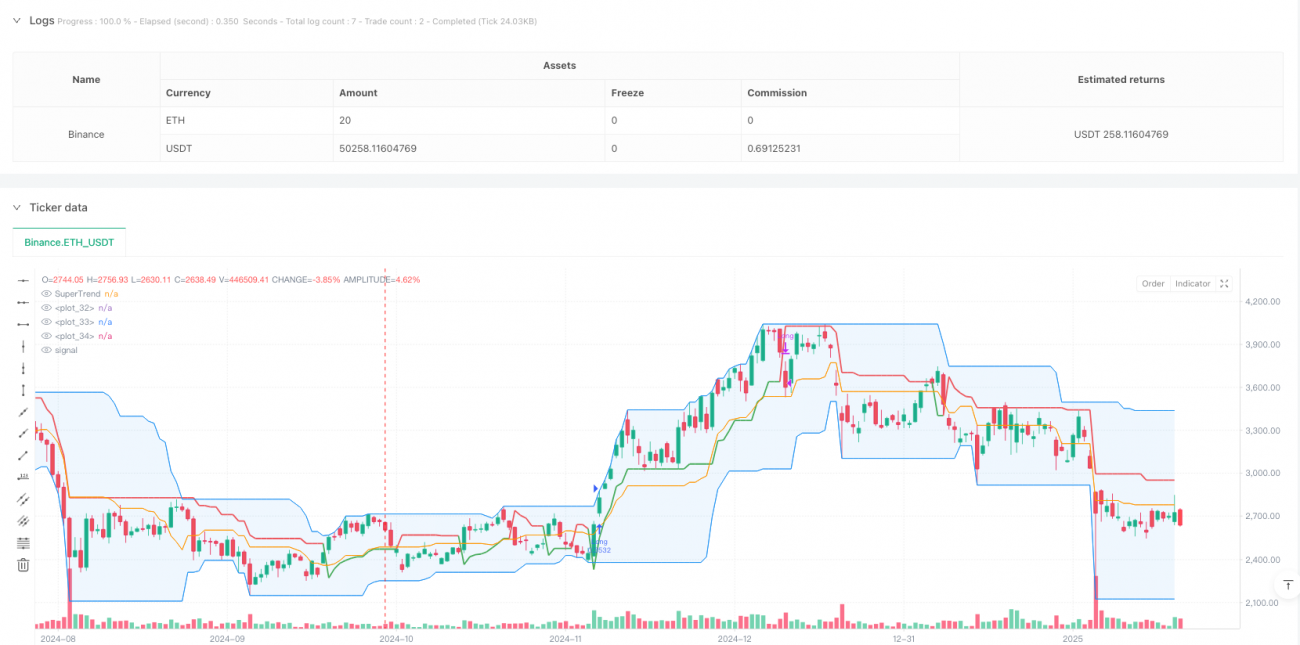
- ڈونگ چیان چینل: صارف کی وضاحت کی مدت کے اندر سب سے زیادہ قیمت اور سب سے کم قیمت کا حساب لگائیں ، اوپری ریل ، ڈور ریل اور مڈل ریل تشکیل دیں۔ جب قیمت اوپری ریل کو توڑتی ہے تو ، کثیر سر داخلہ سگنل کو متحرک کرتی ہے۔
- ٹرانزیکشن فلٹر: موجودہ ٹرانزیکشن کو 20 سیکنڈ کی متحرک اوسط سے موازنہ کرکے ، اس بات کو یقینی بنانا کہ صرف ٹرانزیکشن میں اضافے کے ساتھ ہی کھیل میں داخل ہو ، جس سے توڑ کی وشوسنییتا میں اضافہ ہو۔
- سپر ٹرینڈ انڈیکیٹر: رجحان کی تصدیق کے آلے کے طور پر ، کثیر سر والے رجحانات پر سبز ، اور خالی سر والے رجحانات پر سرخ دکھاتا ہے۔
- لچکدار اسٹاپ میکانیزم: چار مختلف اسٹاپ آپشنز پیش کیے گئے ہیں ، جن میں نیچے کا ٹریک اسٹاپ ، درمیانی ٹریک اسٹاپ ، سپر ٹرینڈ اسٹاپ اور فیصد ٹریکنگ اسٹاپ شامل ہیں۔
اسٹریٹجک فوائد
- ایک سے زیادہ سگنل کی تصدیق: قیمتوں میں توڑ ، حجم کی تصدیق اور رجحان کے اشارے کے ساتھ مل کر ، جعلی توڑنے کے خطرے کو نمایاں طور پر کم کریں۔
- لچکدار: پیرامیٹرز کو ایڈجسٹ کرکے مختلف مارکیٹ کے ماحول اور تجارتی دوروں کے مطابق ڈھالنا۔
- بہتر خطرے کا انتظام: مارکیٹ کی خصوصیات کے مطابق سب سے موزوں روک تھام کا انتخاب کرنے کے لئے متعدد روک تھام کے اختیارات فراہم کریں۔
- واضح بصری: حکمت عملی کا انٹرفیس انڈیکیٹرز کو بصری طور پر پیش کرتا ہے تاکہ تاجروں کو مارکیٹ کی حالت کو سمجھنے میں مدد ملے۔
- ردعمل کی لچک: اپنی مرضی کے مطابق ردعمل کے وقت کی حد کی اجازت دیتا ہے، حکمت عملی کو بہتر بنانے کے لئے آسان ہے.
اسٹریٹجک رسک
- زلزلے کی مارکیٹ کا خطرہ: زلزلے کی صورتحال میں اکثر جھوٹے بریک سگنل پیدا ہوسکتے ہیں۔
- سلائڈ پوائنٹ کا خطرہ: کم لیکویڈیٹی والے بازاروں میں ، بریک سگنل سلائڈ پوائنٹ کی وجہ سے داخلے کی قیمتوں میں انحراف کا سبب بن سکتا ہے۔
- زیادہ سے زیادہ فلٹرنگ کا خطرہ: حجم فلٹرنگ کو فعال کرنے سے آپ کو تجارت کے قابل مواقع سے محروم ہونے کا خطرہ ہے۔
- پیرامیٹر کی حساسیت: حکمت عملی کا اثر پیرامیٹر کی ترتیبات کے لیے حساس ہے اور احتیاط سے اصلاح کی ضرورت ہے۔
حکمت عملی کی اصلاح کی سمت
- رجحان کی طاقت فلٹر شامل کریں: رجحان کی طاقت کے اشارے جیسے ADX کو شامل کیا جاسکتا ہے ، صرف اس وقت داخل ہوتا ہے جب رجحان مضبوط ہو۔
- ٹرانزیکشن ٹرانسمیشن کو بہتر بنائیں: آپ کو سادہ منتقل اوسط کے بجائے رشتہ دار ٹرانسمیشن یا ٹرانسمیشن ٹرانسمیشن کے نشانات کا استعمال کرنے پر غور کرنا چاہئے.
- ٹائم فلٹر شامل کریں: مارکیٹ میں زیادہ اتار چڑھاؤ سے بچنے کے لئے ٹریڈنگ ٹائم ونڈو کی ترتیبات شامل کریں۔
- متحرک پیرامیٹرز کی اصلاح: مارکیٹ میں اتار چڑھاؤ کی شرح کے مطابق خود کار طریقے سے چینل کی مدت اور سپر ٹرینڈ پیرامیٹرز کو ایڈجسٹ کریں۔
- مشین لرننگ متعارف کروانا: پیرامیٹرز کے انتخاب اور سگنل فلٹرنگ کو بہتر بنانے کے لئے مشین لرننگ الگورتھم کا استعمال کریں۔
خلاصہ کریں۔
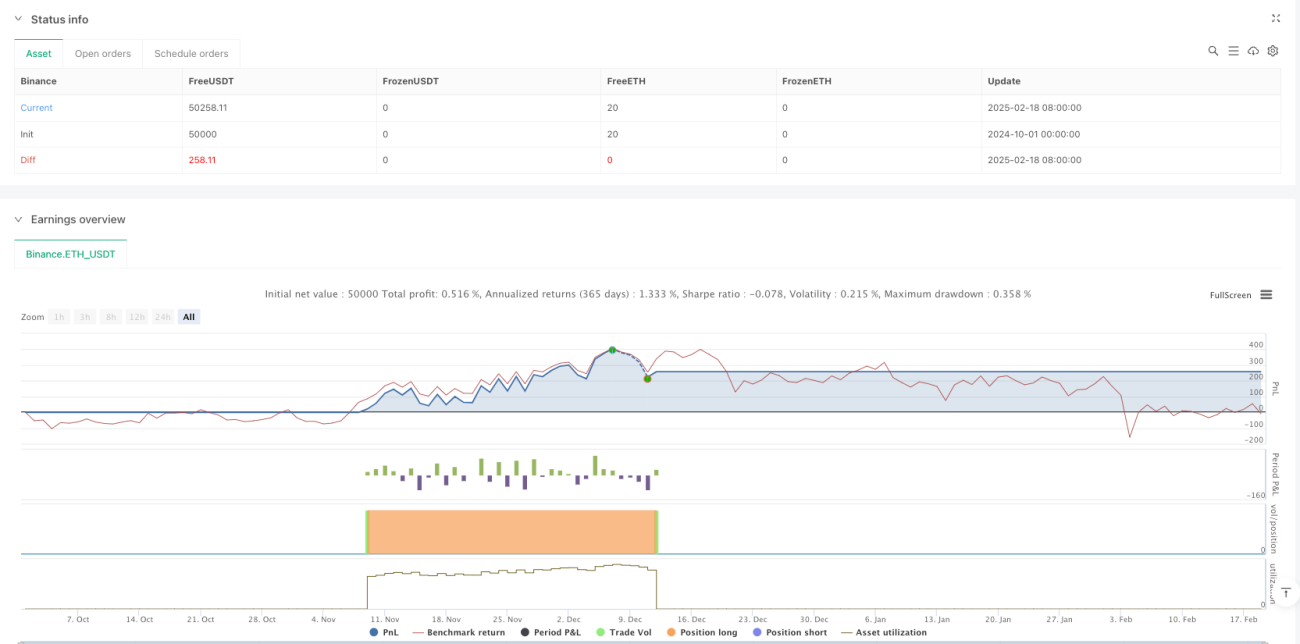
اس حکمت عملی نے متعدد تکنیکی اشارے کے مربوط استعمال کے ذریعے ، ایک نسبتا complete مکمل رجحان ٹریکنگ ٹریڈنگ سسٹم تشکیل دیا ہے۔ اس حکمت عملی کے فوائد سگنل کی اعلی وشوسنییتا ، خطرے کے انتظام میں لچکدار ہیں ، لیکن پھر بھی تاجروں کو مخصوص مارکیٹ کی خصوصیات کے مطابق پیرامیٹرز کو بہتر بنانے کی ضرورت ہے۔ مسلسل بہتری اور اصلاح کے ذریعہ ، اس حکمت عملی کو رجحان مارکیٹ میں مستحکم تجارتی اثر حاصل کرنے کی امید ہے۔
- 1