فالنگ ویج ٹرینڈ لائن مقداری تجارتی حکمت عملی کی متحرک پیش رفت

جائزہ
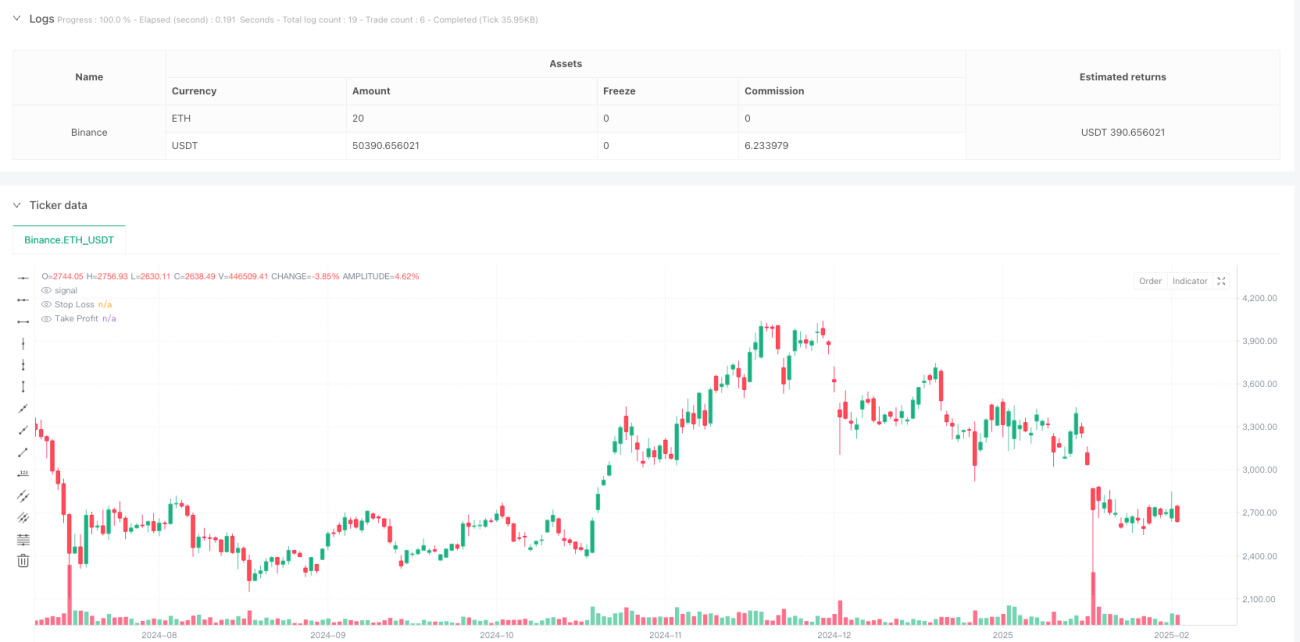
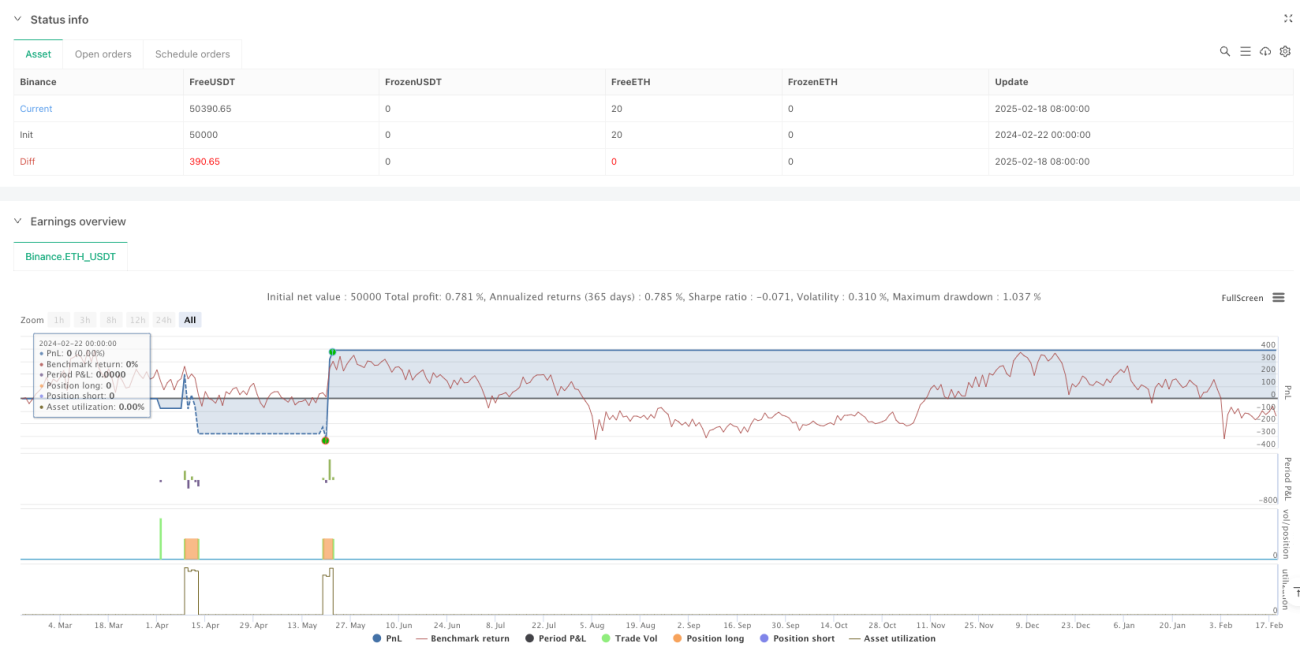
یہ حکمت عملی ایک رجحان توڑنے والی تجارتی نظام ہے جو تکنیکی تجزیہ میں نیچے کی کنگلی کی شکل پر مبنی ہے۔ یہ قیمتوں میں اعلی اور کم کی متحرک شناخت کے ذریعہ ایک اوپر اور نیچے کی رجحان لائن بناتا ہے ، اور جب قیمت ٹرینڈ لائن کو توڑتی ہے تو کثیر پوزیشن میں داخل ہوتا ہے۔ حکمت عملی خطرے کو کنٹرول کرنے اور منافع کو مقفل کرنے کے لئے متحرک اسٹاپ نقصان کا طریقہ کار استعمال کرتی ہے۔ یہ ایک کلاسک تکنیکی تجزیہ ٹریڈنگ طریقہ کار کا ایک طریقہ کار ہے ، خاص طور پر مناسب ہے جب نیچے کی رجحان ختم ہونے والی ہے تو اس میں الٹ موقع پر قبضہ کرنا۔
حکمت عملی کا اصول
اس حکمت عملی کی بنیادی منطق میں درج ذیل اہم اقدامات شامل ہیں:
- قیمتوں کے رجحانات میں اونچائی اور کم کی شناخت کرنے کے لئے محور ((Pivot) کا استعمال کرتے ہوئے متحرک طریقے سے
- دو حالیہ بلند اور کم اور ان کے متعلقہ ٹائم انڈیکس کو ریکارڈ اور محفوظ کریں
- ان پوائنٹس کی بنیاد پر اوپر اور نیچے کی رجحان لائن کا حساب لگانا
- فیصلہ کریں کہ آیا گرنے کا اخترتی تشکیل دیا گیا ہے: دو اونچائیوں کی کمی ، دو نچلی حدوں کی کمی کی ضرورت ہے ، اور اوپر کی رجحان لائن کا جھکاؤ نیچے کی رجحان لائن سے کم ہے
- جب قیمت اوپر کی رجحان لائن کو توڑتی ہے تو ، خریدنے کا اشارہ ہوتا ہے
- اسٹاپ نقصان کی فیصد کی بنیاد پر اسٹاپ نقصان کی شرط مقرر کریں
اسٹریٹجک فوائد
- متحرک مارکیٹ کی ساخت کی شناخت: حکمت عملی قیمتوں کے ڈھانچے میں اہم نکات کی خود بخود شناخت کرسکتی ہے ، بغیر کسی انسانی مداخلت کی ضرورت ہوتی ہے۔
- رجحان کی واپسی پر قبضہ: نیچے کی طرف رجحان کے ممکنہ واپسی کے مواقع پر قبضہ کرنے پر توجہ مرکوز کرنا ، جو عام طور پر زیادہ منافع بخش تجارت کا موقع ہوتا ہے
- درست سگنل کی پیداوار: ریاضی کے طریقوں سے رجحان لائن کے مقام اور بریک پوائنٹس کا درست حساب کتاب
- اعلی درجے کی خطرے کا انتظام: ہر تجارت کے خطرے کو مؤثر طریقے سے کنٹرول کرنے کے لئے پہلے سے طے شدہ اسٹاپ نقصان کا طریقہ کار شامل ہے
- منظم آپریشن: حکمت عملی کی منطق کو مکمل طور پر منظم کیا گیا ہے ، جس سے انسانی جذباتی مداخلت کو روکا گیا ہے۔
اسٹریٹجک رسک
- جھوٹی بریک کا خطرہ: مارکیٹ میں جھوٹی بریک ہوسکتی ہے ، جس سے غلط سگنل ملتے ہیں
- پیرامیٹر کی حساسیت: حکمت عملی کا اثر پیرامیٹر کی ترتیبات کے لیے حساس ہے، اور مختلف مارکیٹ کے ماحول میں پیرامیٹرز کی ایڈجسٹمنٹ کی ضرورت پڑ سکتی ہے۔
- مارکیٹ کے حالات پر انحصار: اسٹریٹجی نے ہلچل مچانے والی مارکیٹوں میں بہت زیادہ غلط سگنل پیدا کیے
- اسٹاپ نقصان کا خطرہ: تیزی سے چلنے والے واقعات سے قیمتوں میں اصل اسٹاپ نقصان کا خطرہ ہوسکتا ہے
- ٹرانزیکشن لاگت کا اثر: بار بار ٹرانزیکشنز کے نتیجے میں اعلی ٹرانزیکشن لاگت آسکتی ہے
حکمت عملی کی اصلاح کی سمت
- سگنل کی توثیق کا طریقہ کار: ٹرانسمیشن ، طاقت اور اس طرح کے اشارے کو توڑنے کی تصدیق کے طور پر شامل کیا جاسکتا ہے
- متحرک پیرامیٹرز کی اصلاح: مارکیٹ میں اتار چڑھاؤ کی شرح کے مطابق پیرامیٹرز کو ایڈجسٹ کرنے کے لئے ایک موافقت کا طریقہ کار متعارف کرایا گیا ہے
- ملٹی ٹائم سائیکل کی توثیق: ملٹی ٹائم سائیکل کی توثیق کے طریقہ کار کو شامل کرنا ، سگنل کی وشوسنییتا کو بہتر بنانا
- بہتر سٹاپ نقصان: متحرک سٹاپ نقصان کا استعمال کیا جا سکتا ہے، جیسے ٹریکنگ سٹاپ نقصان
- مارکیٹ کے ماحول کو فلٹر کریں: رجحان فلٹر شامل کریں اور مناسب مارکیٹ کے ماحول میں تجارت کریں
خلاصہ کریں۔
یہ ایک مناسب ڈیزائن کردہ رجحان ٹریڈنگ حکمت عملی ہے ، جو روایتی تکنیکی تجزیہ کے طریقوں کو پروگرام کے ذریعہ نافذ کرتی ہے۔ حکمت عملی کی طاقت مارکیٹ کی ساخت کی خود کار طریقے سے شناخت کرنے اور ممکنہ رجحان الٹ مواقع کو پکڑنے میں ہے۔ لیکن اس کے ساتھ ساتھ جعلی توڑ اور پیرامیٹرز کی اصلاح جیسے مسائل پر بھی توجہ دینے کی ضرورت ہے۔ مزید اصلاح اور بہتری کے ساتھ ، اس حکمت عملی کو حقیقی تجارت میں بہتر کارکردگی کا مظاہرہ کرنے کی امید ہے۔
/*backtest
start: 2025-04-11 00:00:00
end: 2025-07-10 00:00:00
period: 10m
basePeriod: 10m
exchanges: [{"eid":"Binance","currency":"BTC_USDT","balance":200000}]
*/

// This Pine Script™ code is subject to the terms of the Mozilla Public License 2.0 at https://mozilla.org/MPL/2.0/

//@version=6
strategy("Falling Wedge Strategy by Nitin", overlay=true)- 1