
جائزہ
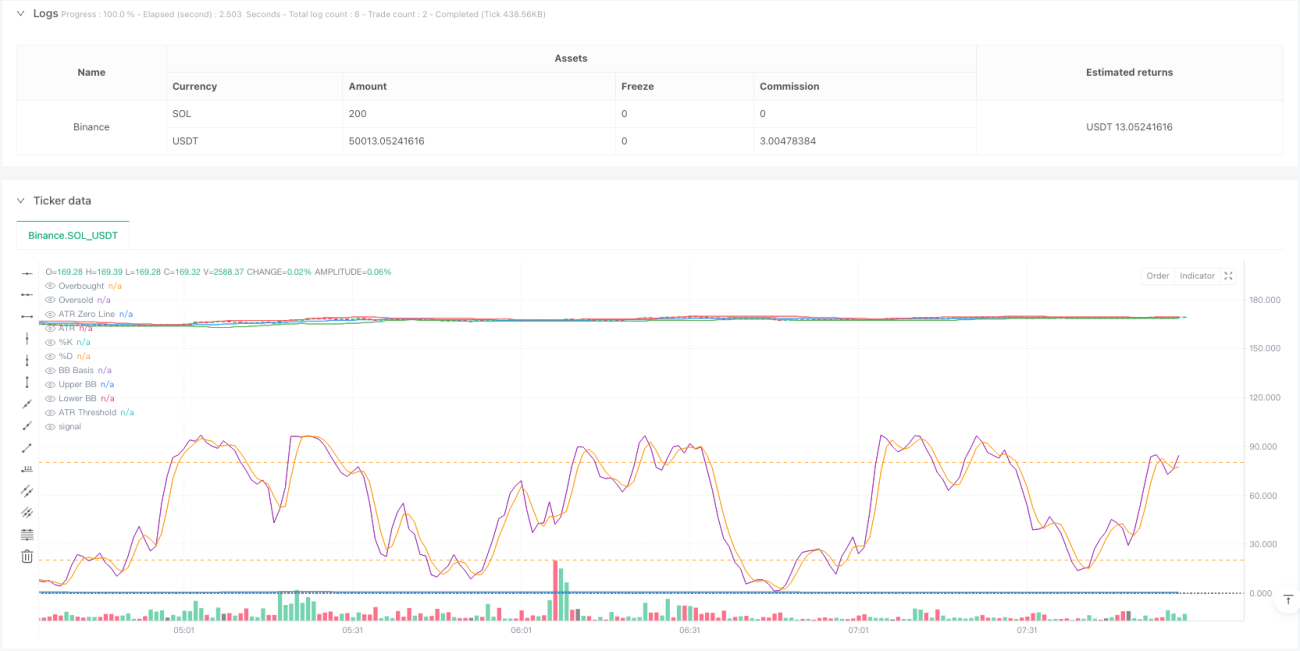
یہ حکمت عملی ایک ذہین تجارتی نظام ہے جو متعدد تکنیکی اشارے پر مبنی ہے ، جس میں تین بڑے تکنیکی اشارے شامل ہیں: بولنگر بینڈ ، اسٹوچاسٹک اوسلیٹر اور اوسط حقیقی طول و عرض (اے ٹی آر) ، جو مارکیٹ میں اتار چڑھاؤ ، حرکیات اور رجحانات کے جامع تجزیے کے ذریعہ ممکنہ تجارتی مواقع کی نشاندہی کرتی ہے۔ حکمت عملی متحرک اسٹاپ نقصان اور منافع کے اہداف کی ترتیب کا استعمال کرتی ہے ، جو مارکیٹ میں اتار چڑھاؤ کی صورت حال کے مطابق ٹریڈنگ پیرامیٹرز کو خود بخود ایڈجسٹ کرسکتی ہے۔
حکمت عملی کا اصول
اس حکمت عملی کی بنیادی منطق تینوں قسم کی توثیق پر مبنی ہے:
- قیمتوں کے اتار چڑھاؤ کے لئے بلین بینڈ کی حد کی تعریف کا استعمال کرتے ہوئے ، جب قیمت بلین بینڈ سے ٹکرا جاتی ہے تو اوور سیل کے مواقع کی نشاندہی کریں ، اور جب وہ ٹریک پر ٹکرا جاتی ہے تو اوور خرید کے مواقع کی نشاندہی کریں
- بے ترتیب اشارے کے ذریعہ اوور بائی زون ((> 80) اور اوور سیل زون ((<20) میں حرکیات کی تصدیق ،٪ K لائن اور٪ D لائن کے کراسنگ کے طور پر انٹری سگنل
- اے ٹی آر اشارے کو اتار چڑھاؤ کے فلٹر کے طور پر متعارف کرایا گیا ہے تاکہ یہ یقینی بنایا جاسکے کہ مارکیٹ میں کافی اتار چڑھاؤ کی حمایت کے ساتھ تجارت کی جائے۔
ٹریڈنگ سگنل کی تخلیق کے لئے مندرجہ ذیل شرائط کو پورا کرنا ضروری ہے:
خریداری کی شرائط:
- قیمتوں کا اختتام برن کی نیچے کی پٹری پر
- بے ترتیب اشارے٪ K لائن اوور سیل علاقے میں اوپر کی طرف سے٪ D لائن کو پار کرتی ہے
- اے ٹی آر مقررہ حد سے زیادہ ہے ، مارکیٹ میں کافی اتار چڑھاؤ کی تصدیق کرتا ہے
فروخت کی شرائط:
- قیمتوں کا اختتام برن بینڈ سے اوپر
- بے ترتیب اشارے٪ K لائن اوورلوڈ علاقے میں نیچے کی طرف سے٪ D لائن کو پار کرتی ہے
- اے ٹی آر کی قیمتوں میں کمی سے اوپر برقرار رکھنے سے تجارت کی توثیق
اسٹریٹجک فوائد
- کثیر تکنیکی اشارے کی کراس توثیق ، ٹریڈنگ سگنل کی وشوسنییتا میں نمایاں اضافہ
- متحرک اسٹاپ نقصان اور منافع کے اہداف کی ترتیب ، جو مارکیٹ میں اتار چڑھاؤ کے مطابق خود بخود رسک مینجمنٹ پیرامیٹرز کو ایڈجسٹ کرتی ہے
- اتار چڑھاؤ فلٹرنگ میکانزم کم اتار چڑھاؤ کے دوران غلط سگنل کو مؤثر طریقے سے روکتا ہے
- انڈیکس پیرامیٹرز کو مختلف مارکیٹ کے حالات کے مطابق لچکدار طور پر ایڈجسٹ کیا جاسکتا ہے ، جس میں اچھی موافقت ہے
- حکمت عملی کی منطق واضح ، سمجھنے اور لاگو کرنے میں آسان ، ہر سطح کے تاجر کے لئے موزوں ہے
اسٹریٹجک رسک
- مارکیٹ میں شدید اتار چڑھاؤ کے دوران ممکنہ طور پر سلائڈ پوائنٹس جو اصل عملدرآمد کی قیمتوں کو متاثر کرتے ہیں
- ایک سے زیادہ اشارے کا استعمال سگنل کی تاخیر کا سبب بن سکتا ہے اور بہترین انٹری کا وقت کھو سکتا ہے
- پیرامیٹرز کو زیادہ سے زیادہ بہتر بنانا ممکنہ طور پر زیادہ فٹ ہونے کا سبب بن سکتا ہے ، جس سے حکمت عملی کی کارکردگی متاثر ہوتی ہے
- ٹرینڈ ٹرن آؤٹ پوائنٹس پر جھوٹے سگنل ہوسکتے ہیں ، جس کے لئے دیگر تجزیاتی ٹولز کی ضرورت ہوتی ہے۔
- ٹرانزیکشن لاگت اور کمیشن حکمت عملی کی مجموعی آمدنی کی کارکردگی کو متاثر کرسکتے ہیں
حکمت عملی کی اصلاح کی سمت
- ٹرینڈ فلٹرز متعارف کروائیں ، جیسے کہ بڑھتی ہوئی اوسط کراسنگ سسٹم ، تاکہ رجحانات کی تصدیق میں اضافہ کیا جاسکے
- اے ٹی آر کی تخفیف کے لئے متحرک ایڈجسٹمنٹ میکانزم کو بہتر بنانے کے لئے تاکہ یہ مختلف مارکیٹ کے حالات کے مطابق بہتر ہو سکے
- ٹرانزیکشن سگنلز کی وشوسنییتا کو بہتر بنانے کے لئے ٹرانزیکشن حجم اشارے کی توثیق میں اضافہ
- مارکیٹ کی حالت کے مطابق اشارے کے پیرامیٹرز کو خود بخود ایڈجسٹ کرنے کے لئے خود کار طریقے سے ایڈجسٹ پیرامیٹرز کو بہتر بنانا
- وقت کے فلٹرز کو شامل کریں تاکہ مارکیٹ میں زیادہ اتار چڑھاؤ کے دوران تجارت سے بچ سکے۔
خلاصہ کریں۔
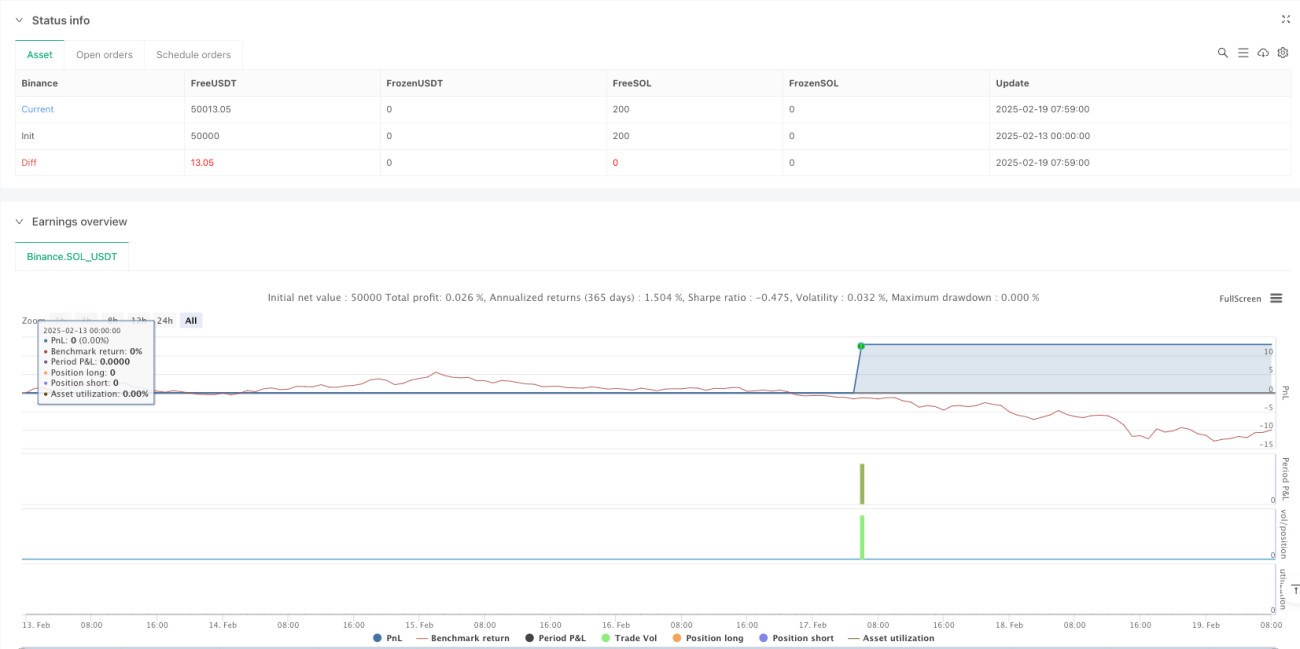
اس حکمت عملی نے برن بینڈ ، بے ترتیب اشارے اور اے ٹی آر کے مجموعی استعمال کے ذریعے ایک مکمل تجارتی نظام تشکیل دیا ہے۔ اس حکمت عملی کے فوائد کثیر اشارے کی کراس توثیق اور متحرک خطرے کے انتظام میں ہیں ، لیکن اس کے ساتھ ساتھ پیرامیٹرز کی اصلاح اور مارکیٹ کے ماحول میں موافقت کے مسائل پر بھی توجہ دینے کی ضرورت ہے۔ اس حکمت عملی کو مستقل طور پر بہتر بنانے اور بہتر بنانے کے ذریعہ ، حقیقی تجارت میں مستحکم منافع بخش کارکردگی کی توقع ہے۔
/*backtest
start: 2025-02-13 00:00:00
end: 2025-02-19 08:00:00
period: 1m
basePeriod: 1m
exchanges: [{"eid":"Binance","currency":"SOL_USDT"}]
*/

//@version=5
strategy("Bollinger Bands + Stochastic Oscillator + ATR Strategy", overlay=true, default_qty_type=strategy.percent_of_equity, default_qty_value=10)

// Bollinger Bands Parameters- 1