RSI اور Stochastic RSI پر مبنی دوہری مومنٹم ٹرینڈ ریورسل حکمت عملی

جائزہ
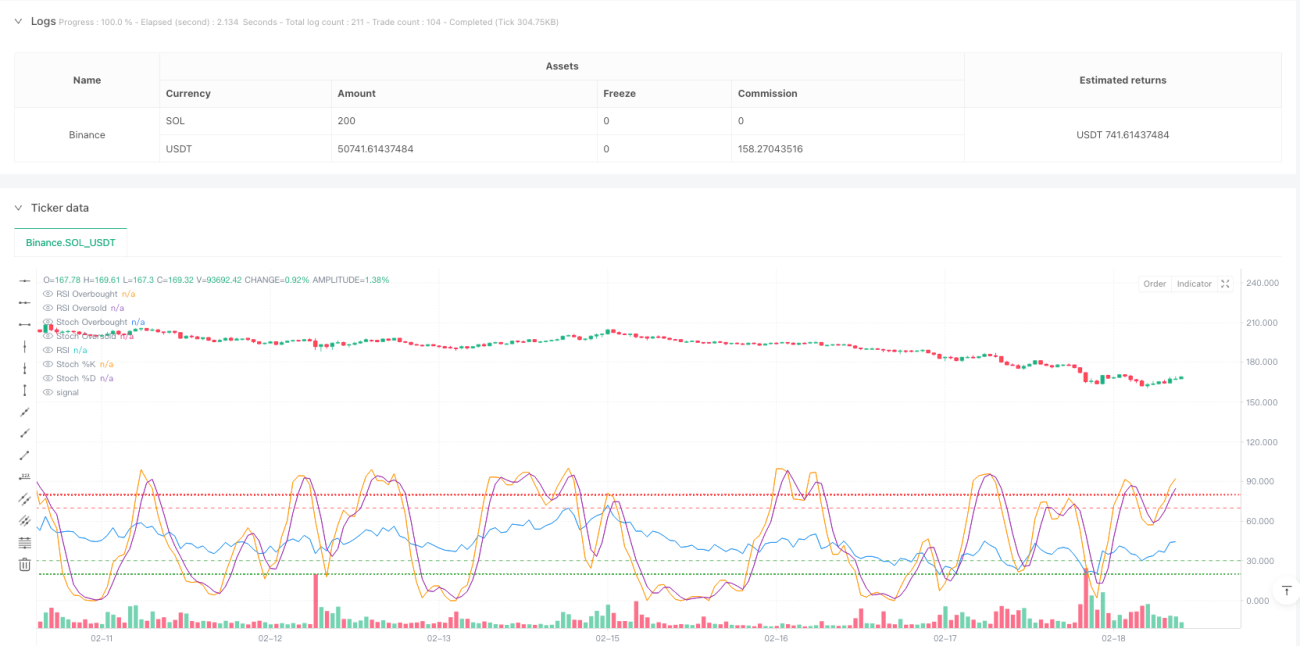
یہ ایک رجحان الٹ ٹریڈنگ حکمت عملی ہے جس میں ایک نسبتا weak مضبوط اشارے ((RSI) اور ایک بے ترتیب نسبتا strong مضبوط اشارے ((Stochastic RSI) کو ملا دیا گیا ہے۔ اس حکمت عملی میں مارکیٹ میں اوورلوڈ اور اوور سیل کی حیثیت کی نشاندہی کی گئی ہے تاکہ ممکنہ الٹ کو پکڑنے کے لئے تجارت کی جاسکے۔ اس حکمت عملی کا مرکز آر ایس آئی کو بنیادی متحرک اشارے کے طور پر استعمال کرنا ہے ، اور پھر اس کی بنیاد پر اسٹوکاسٹک آر ایس آئی کا حساب کتاب کرنا ہے تاکہ قیمت کی نقل و حرکت کی سمت کی مزید تصدیق کی جاسکے۔
حکمت عملی کا اصول
حکمت عملی کی بنیادی منطق میں درج ذیل اہم اقدامات شامل ہیں:
- سب سے پہلے ، مجموعی طور پر اوورلوڈ اور اوورلوڈ ہونے کا اندازہ لگانے کے لئے اختتامی قیمتوں کے آر ایس آئی کی مقدار کا حساب لگائیں
- اسٹوکاسٹک RSI کی %K لائن اور %D لائن کو RSI ویلیو کی بنیاد پر حساب لگائیں
- جب RSI oversold زون میں ہوتا ہے (ڈیفالٹ 30 سے نیچے) اور Stochastic RSI کی٪ K لائن نیچے سے اوپر کی طرف سے٪ D لائن کو عبور کرتی ہے تو ، ایک کثیر سگنل کو متحرک کیا جاتا ہے
- جب آر ایس آئی اووربڈ زون میں ہے (ڈیفالٹ 70 سے اوپر) اور اسٹوکاسٹک آر ایس آئی کی٪ K لائن اوپر سے نیچے سے٪ D لائن کو عبور کرتی ہے تو ، خالی کرنے کا اشارہ ہوتا ہے
- جب مخالف RSI حالات یا Stochastic RSI ریورس کراسنگ کا سامنا ہوتا ہے تو ، صفائی سے باہر نکلیں
اسٹریٹجک فوائد
- دوہری تصدیق کا طریقہ کار - آر ایس آئی اور اسٹوکاسٹک آر ایس آئی کے ساتھ مل کر استعمال کرتے ہوئے ، جعلی بریک کے خطرے کو مؤثر طریقے سے کم کیا جاسکتا ہے
- اپنی مرضی کے مطابق پیرامیٹرز - حکمت عملی کے اہم پیرامیٹرز جیسے آر ایس آئی سائیکل ، اوورلوڈ اوورلوڈ تھروئل وغیرہ کو مختلف مارکیٹ کے حالات کے مطابق ایڈجسٹ کیا جاسکتا ہے
- متحرک تصورات - حکمت عملی میں RSI اور Stochastic RSI کے ل real ریئل ٹائم چارٹ ڈسپلے فراہم کیے گئے ہیں تاکہ تاجروں کی نگرانی کی جاسکے
- رسک مینجمنٹ انٹیگریشن - مکمل اسٹاپ نقصان اور منافع بند کرنے کا طریقہ کار شامل ہے
- لچکدار - مختلف وقت کے دور اور مارکیٹ کے حالات پر لاگو ہوتا ہے
اسٹریٹجک رسک
- مارکیٹ میں ہلچل کا خطرہ - اکثر جھوٹے سگنل جنم لے سکتے ہیں
- تاخیر کا خطرہ - ایک سے زیادہ اوسط لائن ہموار ہونے کی وجہ سے سگنل میں کچھ حد تک تاخیر ہوسکتی ہے
- پیرامیٹرز کی حساسیت - مختلف پیرامیٹرز کی ترتیبات نمایاں طور پر مختلف ٹرانزیکشن کے نتائج کا سبب بن سکتی ہیں
- مارکیٹ کے ماحول پر انحصار - مضبوط رجحانات والے بازاروں میں کچھ چیزیں چھوٹ سکتی ہیں
- فنڈ مینجمنٹ رسک - خطرہ کو کنٹرول کرنے کے لئے پوزیشن تناسب کو مناسب طریقے سے ترتیب دینے کی ضرورت ہے
حکمت عملی کی اصلاح کی سمت
- ٹرینڈ فلٹر شامل کریں - طویل مدتی منتقل اوسط کو ٹرینڈ فلٹر کے طور پر شامل کیا جاسکتا ہے ، صرف رجحان کی سمت میں پوزیشنیں کھولی جاسکتی ہیں
- آپٹمائزڈ اسٹاپ میکانزم - متحرک اسٹاپ متعارف کرایا جاسکتا ہے ، جیسے ٹریکنگ اسٹاپ یا اے ٹی آر اسٹاپ
- ٹریفک کے اشارے متعارف کروائے گئے - ٹریفک کے تجزیے کے ساتھ مل کر سگنل کی وشوسنییتا کو بہتر بنایا جاسکتا ہے
- ٹائم فلٹرز شامل کریں - اہم خبروں کی اشاعت یا کم نقل و حرکت کے اوقات سے بچنے کے لئے
- موافقت پذیر پیرامیٹرز تیار کریں - مارکیٹ میں اتار چڑھاو کے مطابق حکمت عملی کے پیرامیٹرز کو خود بخود ایڈجسٹ کریں
خلاصہ کریں۔
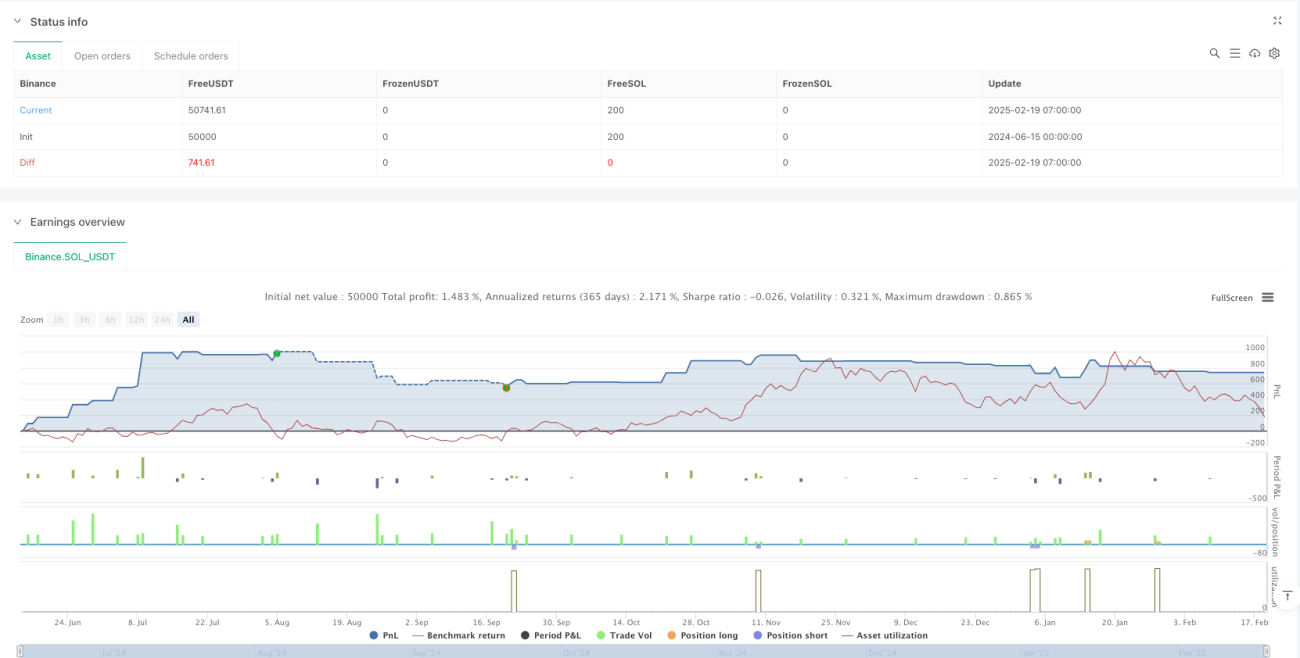
یہ ایک جامع حکمت عملی ہے جس میں حرکیات اور رجحان کی الٹیاں شامل ہیں تاکہ آر ایس آئی اور اسٹوکاسٹک آر ایس آئی کے ہم آہنگی کے ذریعہ ممکنہ تجارتی مواقع کی نشاندہی کی جاسکے۔ حکمت عملی کا ڈیزائن معقول ہے ، اس میں بہتر ایڈجسٹ ایبلٹی اور موافقت ہے۔ لیکن عملی اطلاق میں مارکیٹ کے ماحول کے انتخاب اور خطرے پر قابو پانے پر دھیان دینا ضروری ہے ، اور عملی تجارت سے پہلے کافی ریٹرننگ اور پیرامیٹرز کی اصلاح کی سفارش کی جاتی ہے۔
/*backtest
start: 2024-06-15 00:00:00
end: 2025-02-19 08:00:00
period: 1h
basePeriod: 1h
exchanges: [{"eid":"Binance","currency":"SOL_USDT"}]
*/

//@version=5
strategy("RSI + Stochastic RSI Strategy", overlay=true, initial_capital=100000, default_qty_type=strategy.percent_of_equity, default_qty_value=10)

// INPUTS- 1