
جائزہ
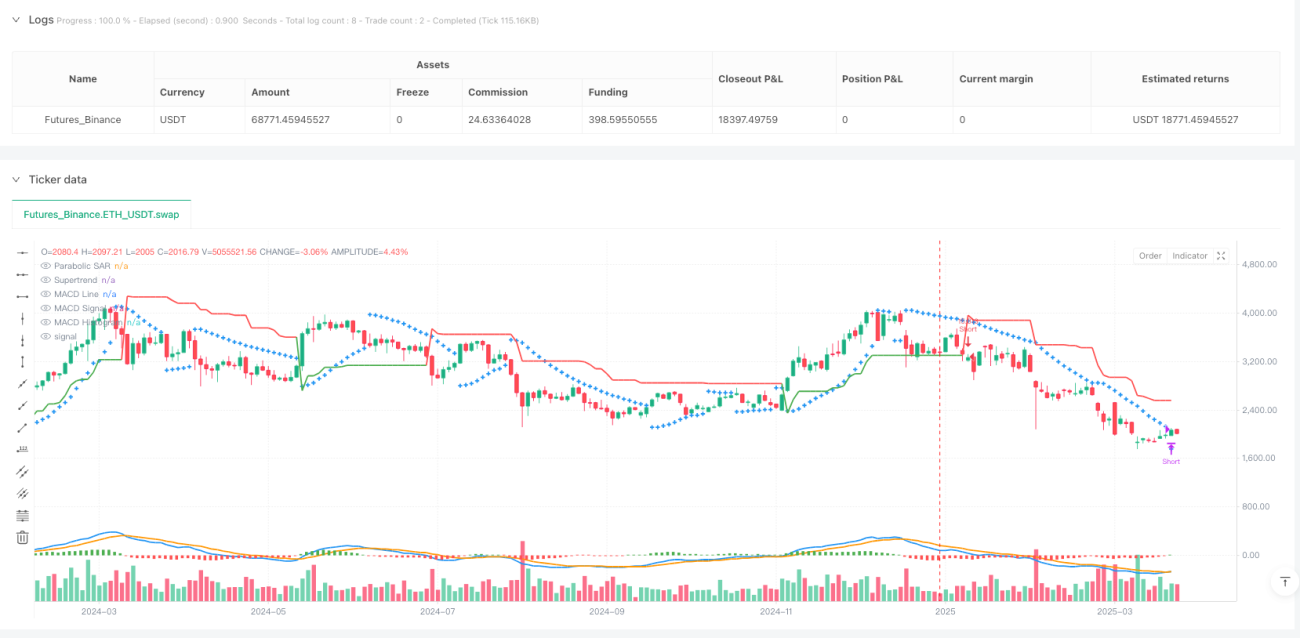
یہ حکمت عملی ایک جامع مقداری تجارتی طریقہ ہے جس میں مارکیٹ کے رجحانات اور تجارتی سگنل کی نشاندہی کرنے کے لئے متعدد تکنیکی اشارے (MACD ، Supertrend اور Parabolic SAR) کو یکجا کیا گیا ہے۔ اس حکمت عملی کا مقصد ایک لچکدار اور سخت تجارتی فیصلے کا فریم ورک فراہم کرنا ہے جو مختلف مارکیٹ کے حالات کے مطابق ڈھال سکتا ہے۔
حکمت عملی کا اصول
حکمت عملی کا اصول تین اہم تکنیکی اشارے کے متحرک مجموعہ پر مبنی ہے:
- MACD اشارے: قیمت کی رفتار اور رجحان کی سمت کا اندازہ لگانا
- سپر ٹرینڈ اشارے: مارکیٹ میں غالب رجحانات کا تعین کریں (پول ہیڈ یا خالی ہیڈ)
- پیراولک ایس اے آر: درست انٹری اور آؤٹ سگنل فراہم کرتا ہے
حکمت عملی مندرجہ ذیل منطق کے ذریعے ٹریڈنگ کے فیصلے کرتی ہے:
- لانگ پوزیشن میں داخلے کی شرائط:
- MACD لائن سگنل لائن سے زیادہ ہے
- سپر ٹرینڈ سبز رنگ میں ظاہر ہوتا ہے
- پیرابولک ایس اے آر سے زیادہ قیمت پر بند ہوا
- خالی گودام میں داخلے کی شرائط:
- MACD لائن سگنل لائن سے نیچے ہے
- سپر ٹرینڈ سرخ (خالی)
- پیرابولک ایس اے آر سے کم قیمت پر بند ہوا
اسٹریٹجک فوائد
- ملٹی انڈیکیٹر انٹیگریٹڈ ویلیڈیشن: جھوٹے سگنل کے خطرے کو کم کرنا
- لچکدار سگنل ٹرگر: اشارے کے ٹرگر کی ترتیب کی سختی کی ضرورت نہیں ہے
- ہول اسٹاک ٹریڈنگ حکمت عملی: ہر تجارت پر ممکنہ منافع کو زیادہ سے زیادہ کرنا
- ہم آہنگ تجارتی منطق: کثیر اور خالی مارکیٹوں میں یکساں کارکردگی
- متحرک باہر نکلنے کا طریقہ کار: دو مسلسل K لائنوں کی توثیق کے ذریعے ، قبل از وقت باہر نکلنے سے بچیں
اسٹریٹجک رسک
- اشارے میں تاخیر کا خطرہ: تکنیکی اشارے تاریخی اعداد و شمار پر مبنی ہیں ، تاخیر کا امکان ہے
- مکمل پوزیشن ٹریڈنگ کا خطرہ: غیر مقررہ اسٹاپ نقصانات سے زیادہ فنڈز میں اتار چڑھاؤ ہوسکتا ہے
- مارکیٹ میں شدید اتار چڑھاؤ کا خطرہ: پیچیدہ مارکیٹ کے حالات حکمت عملی کی کارکردگی کو متاثر کرسکتے ہیں
- پیرامیٹر حساسیت: اشارے کے پیرامیٹرز کا انتخاب براہ راست حکمت عملی کے اثر کو متاثر کرتا ہے
حکمت عملی کی اصلاح کی سمت
- متحرک پوزیشن مینجمنٹ متعارف کروانا: مارکیٹ میں اتار چڑھاؤ کے مطابق پوزیشن کا سائز ایڈجسٹ کرنا
- نقصان کو روکنے کا طریقہ کار میں اضافہ: ایک ہی ٹرانزیکشن میں زیادہ سے زیادہ نقصان کو کم کرنا
- اشارے کے پیرامیٹرز کو بہتر بنائیں: پیمائش کے ذریعے بہترین پیرامیٹرز کا مجموعہ تلاش کریں
- اضافی فلٹرنگ شرائط متعارف کروائیں: جیسے تجارت کا حجم، اتار چڑھاؤ کی شرح کے اشارے
- کثیر ٹائم فریم کی توثیق میں اضافہ: سگنل کی وشوسنییتا میں اضافہ
خلاصہ کریں۔
Vishal کی خود سے منسلک کثیر اشاریہ ٹریڈنگ حکمت عملی ایک جدید مقداری ٹریڈنگ طریقہ ہے جو MACD، Supertrend اور Parabolic SAR کے ہم آہنگی کے ذریعہ ایک جامع اور لچکدار تجارتی فیصلہ سازی کا فریم ورک فراہم کرتا ہے۔ اس کے کثیر اشاریہ کی توثیق اور ہم آہنگی ٹریڈنگ منطق سرمایہ کاروں کے لئے ایک گہرائی سے مطالعہ کرنے کے قابل تجارتی ماڈل فراہم کرتی ہے ، اگرچہ اس میں کچھ خطرہ موجود ہے۔
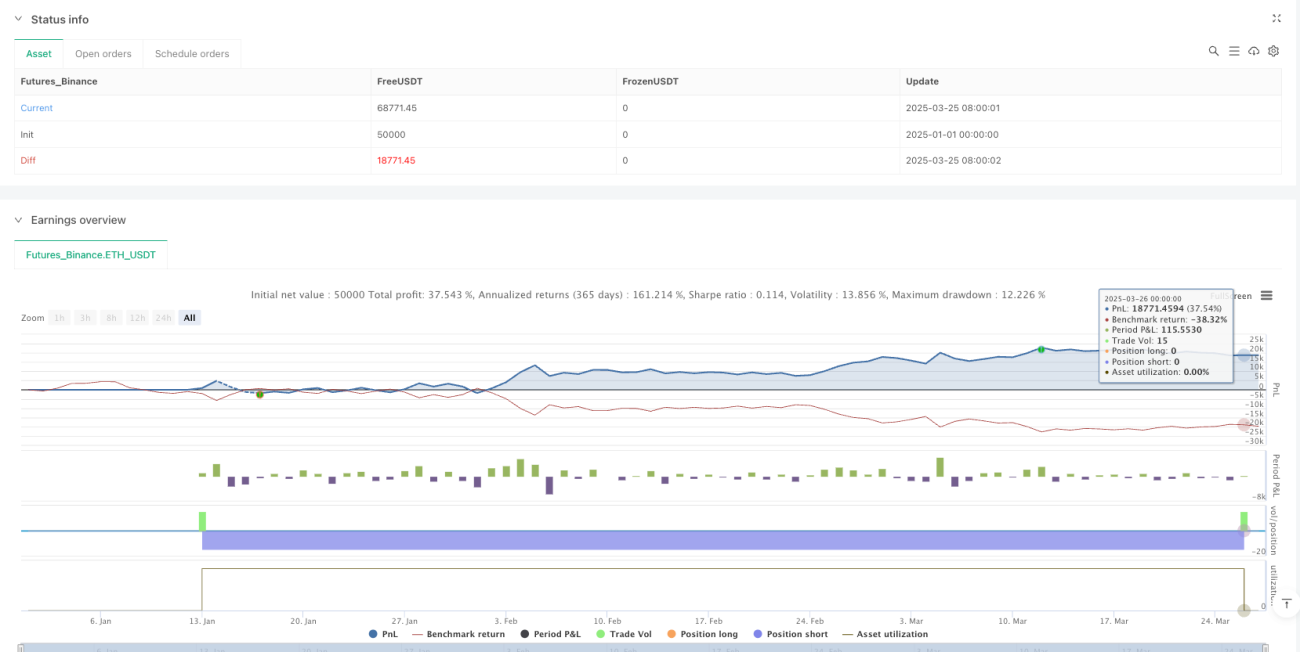
/*backtest
start: 2025-01-01 00:00:00
end: 2025-03-27 00:00:00
period: 2d
basePeriod: 2d
exchanges: [{"eid":"Futures_Binance","currency":"ETH_USDT"}]
*/

//@version=6
strategy("Vishal Strategy", overlay=true, margin_long=100, margin_short=100, initial_capital=100000, default_qty_type=strategy.percent_of_equity, default_qty_value=100)

// **MACD Inputs & Calculation**- 1