جائزہ
یہ ایک جدید مقداری تجارتی حکمت عملی ہے جو تاجروں کو ایک منظم تجارتی طریقہ فراہم کرتی ہے جس میں لیکویڈیٹی زون میں داخلے ، اے ٹی آر میں اتار چڑھاؤ کی کمی اور متحرک خطرے کے انتظام کو مربوط کیا جاتا ہے۔ یہ حکمت عملی متعدد تکنیکی تجزیاتی اشارے کو یکجا کرتی ہے جس کا مقصد اعلی امکانات والے تجارتی مواقع کی نشاندہی کرنا ہے اور خود بخود اسٹاپ اور اسٹاپ نقصان کی سطح کا حساب لگانا ہے۔
حکمت عملی کا اصول
اس حکمت عملی کے بنیادی اصول مندرجہ ذیل اہم عناصر پر مبنی ہیں:
- لیکویڈیٹی زون تجزیہ: کسی خاص دورانیے میں کم سے کم اور زیادہ سے زیادہ پوائنٹس کی گنتی کرکے ممکنہ معاونت اور مزاحمت کے علاقوں کی شناخت کریں۔
- اے ٹی آر اتار چڑھاؤ کی شرح فلٹرنگ: اوسط حقیقی اتار چڑھاؤ کی حد ((اے ٹی آر) کو داخلے اور خطرے کے انتظام کے لئے متحرک حد کے طور پر استعمال کریں۔
- رجحان فلٹرنگ: مارکیٹ کے رجحانات اور حرکیات کی تصدیق کرنے کے لئے 50 دورانیہ اشاریہ منتقل اوسط ((EMA) اور نسبتا مضبوط اشاریہ ((RSI)) کے ساتھ مل کر۔
- متحرک رسک مینجمنٹ: اے ٹی آر کے مطابق خود کار طریقے سے اسٹاپ اور نقصان کی سطح کا حساب لگائیں ، اور رسک / ریٹرن تناسب کو لچکدار انداز میں ایڈجسٹ کرنے کی اجازت دیں۔
اسٹریٹجک فوائد
- کثیر جہتی سگنل جنریشن: سیالیت ، اتار چڑھاؤ اور رجحان فلٹرنگ کو ملا کر ، سگنل کے معیار کو بہتر بنائیں۔
- انکولی خطرے کا انتظام: متحرک طور پر اسٹاپ نقصان کو ایڈجسٹ کریں ، اور تجارت کے خطرے کو مؤثر طریقے سے کنٹرول کریں۔
- لچکدار پیرامیٹرز کی ترتیب: اے ٹی آر کی لمبائی ، لیکویڈیٹی سائیکل اور ٹرانزیکشن کا وقت اپنی مرضی کے مطابق کیا جاسکتا ہے۔
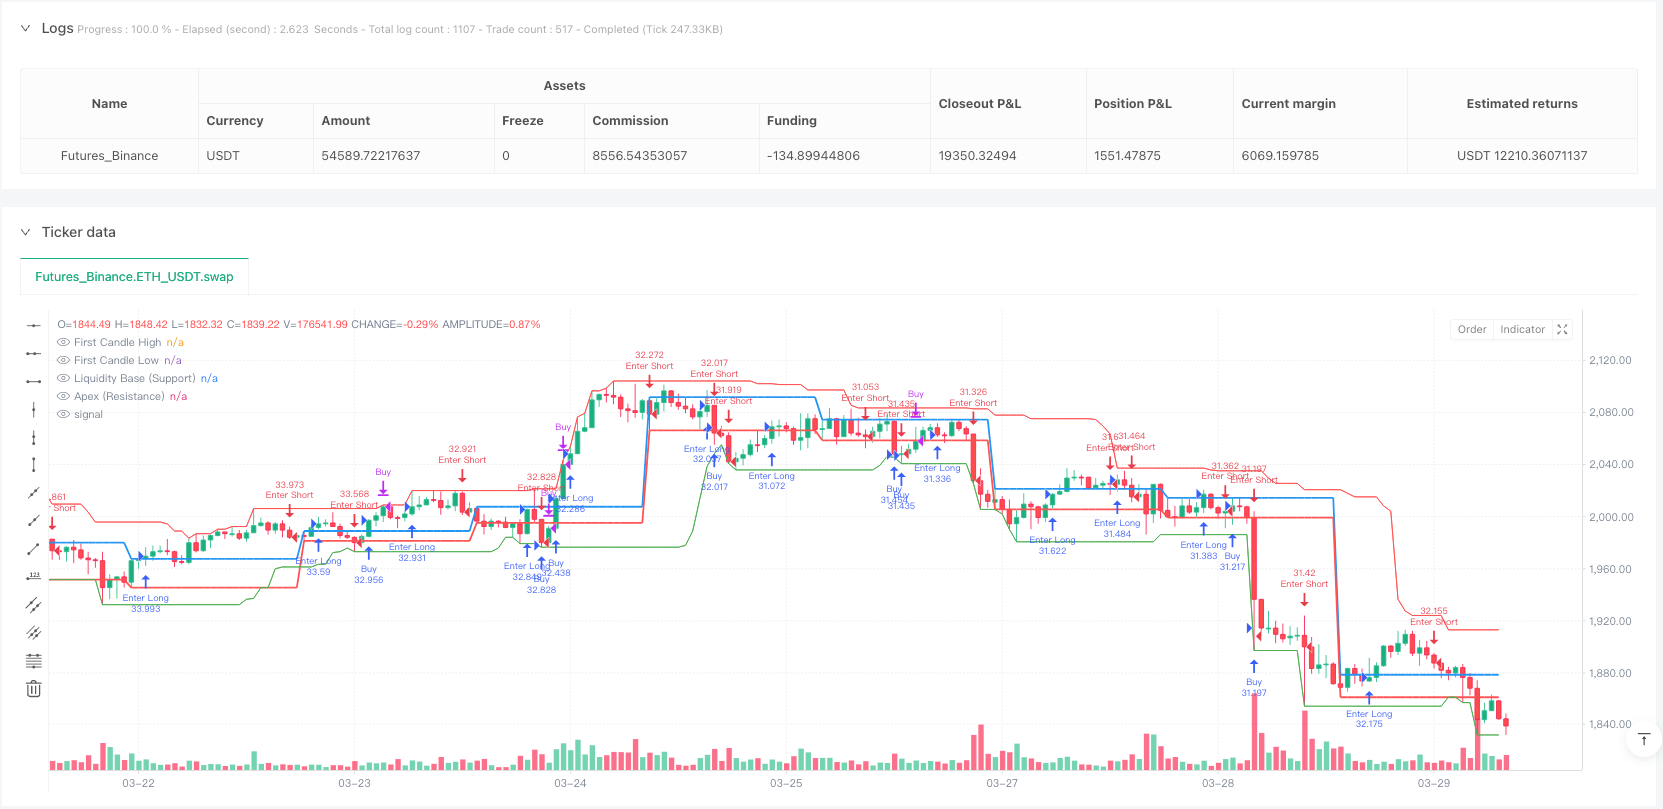
- بصری معاونت: روانی لائن اور پہلی K لائن کی سطح کی بصری نمائش فراہم کرتی ہے۔
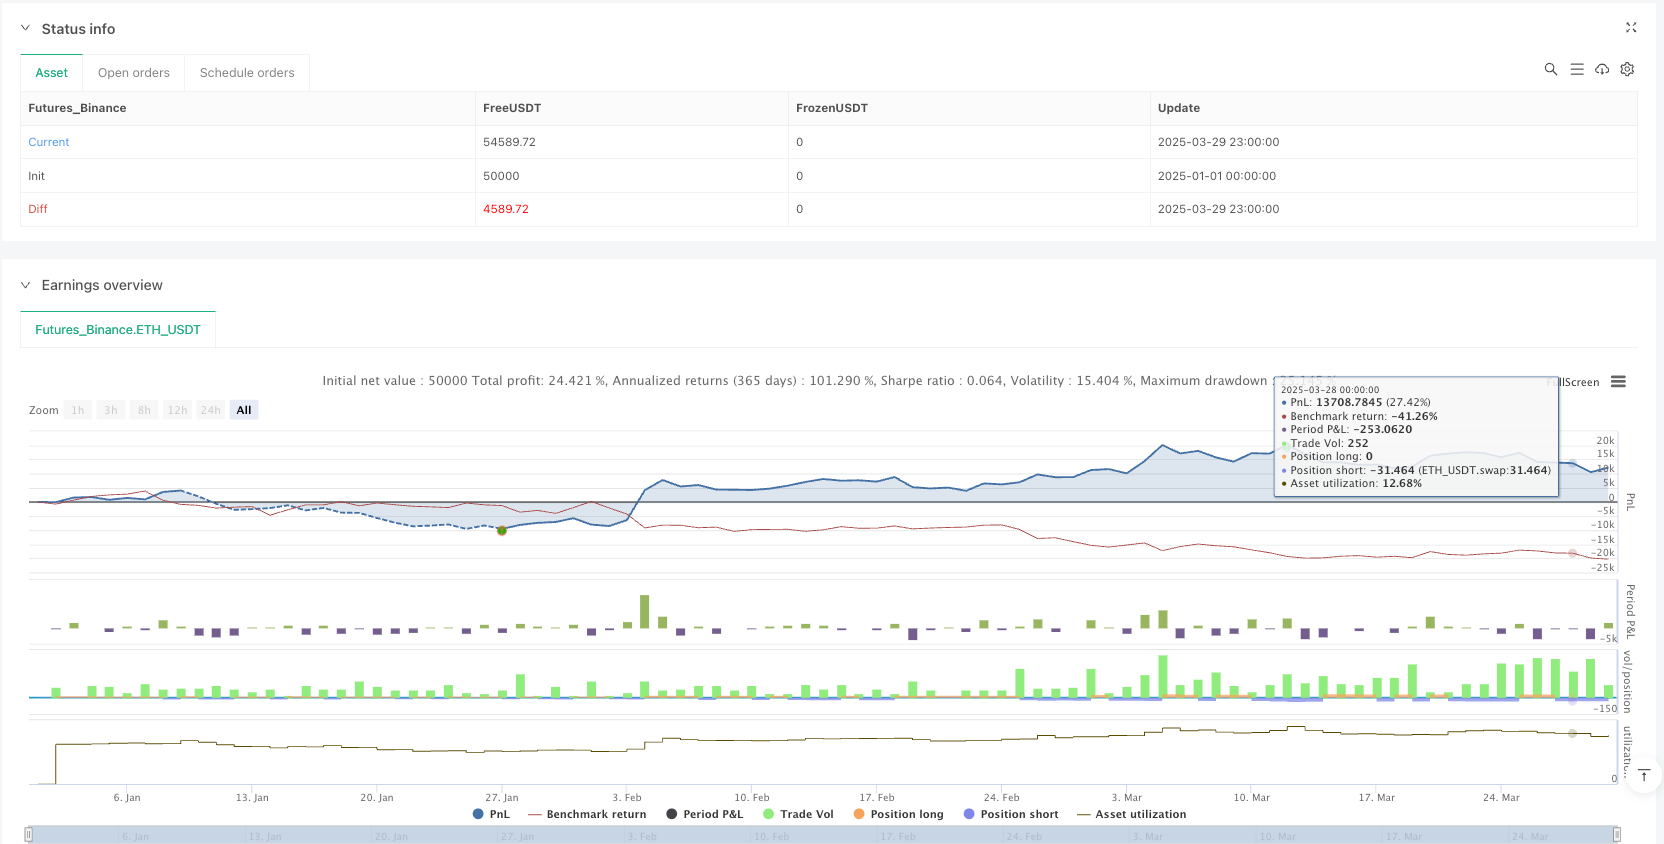
- کارکردگی کا سراغ لگانا: بلٹ ان ٹریڈنگ کے اعدادوشمار ، براہ راست چارٹ پر جیت کی شرح اور ہار جیت کی نمائش۔
اسٹریٹجک رسک
- پیرامیٹر حساسیت: حکمت عملی کی کارکردگی پیرامیٹرز کے انتخاب پر بہت زیادہ انحصار کرتی ہے ، جس کی مسلسل جانچ پڑتال اور اصلاح کی ضرورت ہے۔
- مارکیٹ کی موافقت: غیر واضح رجحانات یا انتہائی اتار چڑھاؤ والے بازاروں میں کارکردگی غیر مستحکم ہوسکتی ہے۔
- جعلی دراندازی کا خطرہ: ممکنہ طور پر غلط اطلاع دینے کا امکان ہے کہ مائع علاقوں میں دراندازی ہوئی ہے۔
- تجارت کی فریکوئنسی: سیشن فلٹرنگ اور متعدد شرائط کے نتیجے میں تجارت کے مواقع کم ہوسکتے ہیں۔
- ریٹائرمنٹ کا تعاقب: 64 فیصد کامیابی کی شرح ممکنہ طور پر مستقبل کی کارکردگی کی نمائندگی نہیں کرتی ہے۔
حکمت عملی کی اصلاح کی سمت
- مشین لرننگ انٹیگریشن: مشین لرننگ الگورتھم متعارف کروانا متحرک ایڈجسٹمنٹ پیرامیٹرز اور سگنل جنریشن۔
- کثیر مارکیٹ مطابقت: مختلف مارکیٹوں اور اقسام کے لئے زیادہ عام پیرامیٹرز کی ترتیبات کی ترقی.
- گہرائی میں رسک مینجمنٹ: زیادہ پیچیدہ پوزیشن سائز اور رسک تقسیم الگورتھم متعارف کرایا۔
- سگنل کی توثیق کا طریقہ کار: اضافی توثیقی اشارے شامل کریں ، جیسے ٹرانزیکشن حجم یا دیگر تکنیکی اشارے۔
- ریئل ٹائم پرفارمنس مانیٹرنگ: ریئل ٹائم پرفارمنس تشخیص اور انضمام ایڈجسٹمنٹ ماڈیول تیار کریں۔
خلاصہ کریں۔
تھنک ٹیک اے آئی ٹریڈنگ اسٹریٹجی تاجروں کو جدید کثیر عنصر کے طریقہ کار کے ذریعہ ایک طاقتور مقداری ٹریڈنگ کا آلہ فراہم کرتی ہے۔ حکمت عملی کا مقصد اعلی معیار کے تجارتی مواقع کی نشاندہی کرنا ہے ، جس میں لیکویڈیٹی تجزیہ ، اتار چڑھاؤ کی شرح فلٹرنگ اور متحرک رسک مینجمنٹ کا استعمال کیا گیا ہے۔ تاہم ، حکمت عملی کی مکمل صلاحیت کو پورا کرنے کے لئے تاجروں کو مسلسل پیمائش ، اصلاح اور محتاط اطلاق کی ضرورت ہے۔
/*backtest
start: 2025-01-01 00:00:00
end: 2025-03-30 00:00:00
period: 1h
basePeriod: 1h
exchanges: [{"eid":"Futures_Binance","currency":"ETH_USDT"}]
*/

if high > ta.highest(high[1], 5)
    strategy.entry("Enter Long", strategy.long)
else if low < ta.lowest(low[1], 5)
    strategy.entry("Enter Short", strategy.short)//@version=6
strategy("ThinkTech AI Signals", overlay=true, initial_capital=100000, default_qty_type=strategy.percent_of_equity, default_qty_value=100)

//──────────────────────────────
// Input Settings
//──────────────────────────────
riskRewardRatio    = input.float(title="Risk/Reward Ratio", defval=2.0, minval=1.0, step=0.1)

// Inputs from second script
liquidity_period   = input.int(20, title="Liquidity Base Period")
atr_length         = input.int(14, title="ATR Length")
atr_threshold      = input.float(0.3, title="ATR Breakout Threshold")
take_profit_mult   = input.float(0.25, title="Take-Profit Multiplier")
stop_loss_mult     = input.float(0.75, title="Stop-Loss Multiplier")
vol_filter         = input.bool(true, title="Enable Volume Filter")
session_filter     = input.bool(true, title="Limit to Trading Session")

// Additional inputs for further filtering and settings
atrMultiplier      = input.float(title="ATR Multiplier for Stop Loss", defval=1.5, minval=0.1, step=0.1)
retestCushionLong  = input.float(title="Retest Cushion Factor for BUY", defval=1.0, minval=1.0, step=0.001)
retestCushionShort = input.float(title="Retest Cushion Factor for SELL", defval=1.0, minval=0.0, maxval=1.0, step=0.001)
useTrendFilter     = input.bool(title="Use 50 EMA Trend Filter", defval=true)
useRSIFilter       = input.bool(title="Use RSI Filter", defval=false)
rsiPeriod          = input.int(title="RSI Period", defval=14, minval=1)
rsiOversold        = input.float(title="RSI Oversold Level", defval=30.0, minval=1, maxval=50)
rsiOverbought      = input.float(title="RSI Overbought Level", defval=70.0, minval=50, maxval=100)

// Option to remove plotted lines
showLiquidityLines   = input.bool(true, title="Show Liquidity Lines")
showFirstCandleLines = input.bool(true, title="Show First Candle Level Lines")

//──────────────────────────────
// Calculations & Variables (Liquidity & ATR Based)
//──────────────────────────────
price        = close
atr          = ta.atr(atr_length)
vol_condition = volume > ta.sma(volume, 20)

// Define Liquidity Base and Apex for support/resistance
liquidity_base = ta.lowest(low, liquidity_period)
apex           = ta.highest(high, liquidity_period)
// Track recent highs and lows for filtering
hh = ta.highest(high, 30)
ll = ta.lowest(low, 30)

//──────────────────────────────
// Trade Stats Variables
//──────────────────────────────
var float take_profit = na
var float stop_loss   = na
var bool  in_trade    = false
var int   win_count   = 0
var int   loss_count  = 0

//──────────────────────────────
// ENTRY LOGIC (BUY) Based on Liquidity & ATR
//──────────────────────────────
breakout_up      = price > liquidity_base + (atr * atr_threshold)
point_of_release = ta.crossover(price, liquidity_base) and breakout_up
retest_buy       = price > liquidity_base and price < hh and not in_trade

// Session condition (e.g. trading between 9AM–12PM)
session_condition = (hour >= 9 and hour <= 12) or not session_filter

if (point_of_release or retest_buy) and (vol_condition or not vol_filter) and session_condition
    strategy.entry("Buy", strategy.long)
    take_profit := price + (atr * take_profit_mult)
    stop_loss   := liquidity_base - (atr * stop_loss_mult)
    in_trade    := true
    alert("Buy Signal - Price: " + str.tostring(price), alert.freq_once_per_bar)

//──────────────────────────────
// ENTRY LOGIC (SELL) Based on Liquidity & ATR
//──────────────────────────────
breakout_down = price < apex - (atr * atr_threshold)
clean_break   = ta.crossunder(price, apex) and breakout_down
retest_sell   = price < apex and price > ll and not in_trade

if (clean_break or retest_sell) and (vol_condition or not vol_filter) and session_condition
    strategy.entry("Sell", strategy.short)
    take_profit := price - (atr * take_profit_mult)
    stop_loss   := apex + (atr * stop_loss_mult)
    in_trade    := true
    alert("Sell Signal - Price: " + str.tostring(price), alert.freq_once_per_bar)

//──────────────────────────────
// EXIT LOGIC (For BUY & SELL)
//──────────────────────────────
if strategy.position_size > 0
    if price >= take_profit
        strategy.close("Buy", comment="Take Profit")
        win_count += 1
        in_trade := false
    if price <= stop_loss
        strategy.close("Buy", comment="Stop Loss")
        loss_count += 1
        in_trade := false

if strategy.position_size < 0
    if price <= take_profit
        strategy.close("Sell", comment="Take Profit")
        win_count += 1
        in_trade := false
    if price >= stop_loss
        strategy.close("Sell", comment="Stop Loss")
        loss_count += 1
        in_trade := false

//──────────────────────────────
// Plot Liquidity Lines (Support/Resistance)
//──────────────────────────────
plot(showLiquidityLines ? liquidity_base : na, color=color.green, title="Liquidity Base (Support)")
plot(showLiquidityLines ? apex : na, color=color.red, title="Apex (Resistance)")

//──────────────────────────────
// Debugging Signal Shapes
//──────────────────────────────
plotshape(series=point_of_release, location=location.belowbar, color=color.green, style=shape.triangleup, title="Buy Signal")
plotshape(series=clean_break, location=location.abovebar, color=color.red, style=shape.triangledown, title="Sell Signal")

//──────────────────────────────
// Win/Loss Table Display
//──────────────────────────────
var table t = table.new(position.top_right, 1, 2)
if bar_index == last_bar_index
    table.cell(t, 0, 0, "Wins: " + str.tostring(win_count), bgcolor=color.new(color.green, 80))
    table.cell(t, 0, 1, "Losses: " + str.tostring(loss_count), bgcolor=color.new(color.red, 80))

//──────────────────────────────
// Alert Conditions for Entries and Exits
//──────────────────────────────
alertcondition(point_of_release, title="Buy Alert", message="Buy Signal Triggered")
alertcondition(clean_break, title="Sell Alert", message="Sell Signal Triggered")
var int lastClosedTrades = 0
var bool exitSignal = false
if strategy.closedtrades > lastClosedTrades
    exitSignal := true
    lastClosedTrades := strategy.closedtrades
alertcondition(exitSignal, title="EXIT Signal", message="EXIT signal triggered: Trade has closed (TP or SL reached).")

//──────────────────────────────
// FIRST 15-MINUTE CANDLE CAPTURE (9:30–9:45 AM EST)
//──────────────────────────────
newDay = dayofmonth != dayofmonth[1]
var float fHigh = na
var float fLow  = na
var bool  firstCandleCaptured = false
if newDay
    fHigh := high
    fLow  := low
    firstCandleCaptured := true

//──────────────────────────────
// Additional Filters & Calculations
//──────────────────────────────
// Trend Filter: 50 EMA
ema50       = ta.ema(close, 50)
longFilter  = not useTrendFilter or (close > ema50)
shortFilter = not useTrendFilter or (close < ema50)

// ATR-Based Stop Loss Buffer
atrValue       = ta.atr(14)
stopLossBuffer = atrValue * atrMultiplier

// RSI Calculation (if enabled)
rsiValue = ta.rsi(close, rsiPeriod)

//──────────────────────────────
// ENTRY CONDITIONS (15-Minute Candle Retest)
//──────────────────────────────
// Breakout/Breakdown based on the first candle levels
buyBreakout   = firstCandleCaptured and ta.crossover(close, fHigh)
sellBreakdown = firstCandleCaptured and ta.crossunder(close, fLow)
// Retest conditions: price must retest the level after the breakout/breakdown
buyRetest  = firstCandleCaptured and (low <= fHigh) and (close > fHigh)
sellRetest = firstCandleCaptured and (high >= fLow) and (close < fLow)
// Final entry signals (with optional RSI filter)
buySignal  = buyBreakout and buyRetest and longFilter and (strategy.position_size == 0) and (not useRSIFilter or (rsiValue < rsiOversold))
sellSignal = sellBreakdown and sellRetest and shortFilter and (strategy.position_size == 0) and (not useRSIFilter or (rsiValue > rsiOverbought))

//──────────────────────────────
// Trade Parameters for 15-Minute Candle Retest
//──────────────────────────────
candleRange    = fHigh - fLow
stopLossBuy    = fLow - stopLossBuffer
takeProfitBuy  = fHigh + (candleRange * riskRewardRatio)
stopLossSell   = fHigh + stopLossBuffer
takeProfitSell = fLow - (candleRange * riskRewardRatio)

//──────────────────────────────
// Execute Trades for 15-Minute Candle Retest
//──────────────────────────────
if buySignal
    strategy.entry("BUY", strategy.long)
    strategy.exit("TP/SL BUY", "BUY", stop=stopLossBuy, limit=takeProfitBuy)

if sellSignal
    strategy.entry("SELL", strategy.short)
    strategy.exit("TP/SL SELL", "SELL", stop=stopLossSell, limit=takeProfitSell)

//──────────────────────────────
// Plot First Candle Level Lines (Optional)
//──────────────────────────────
plot(showFirstCandleLines and firstCandleCaptured ? fHigh : na, title="First Candle High", color=color.blue, linewidth=2)
plot(showFirstCandleLines and firstCandleCaptured ? fLow : na, title="First Candle Low", color=color.red, linewidth=2)