
2
Follow
502
Followers
خلاصہ
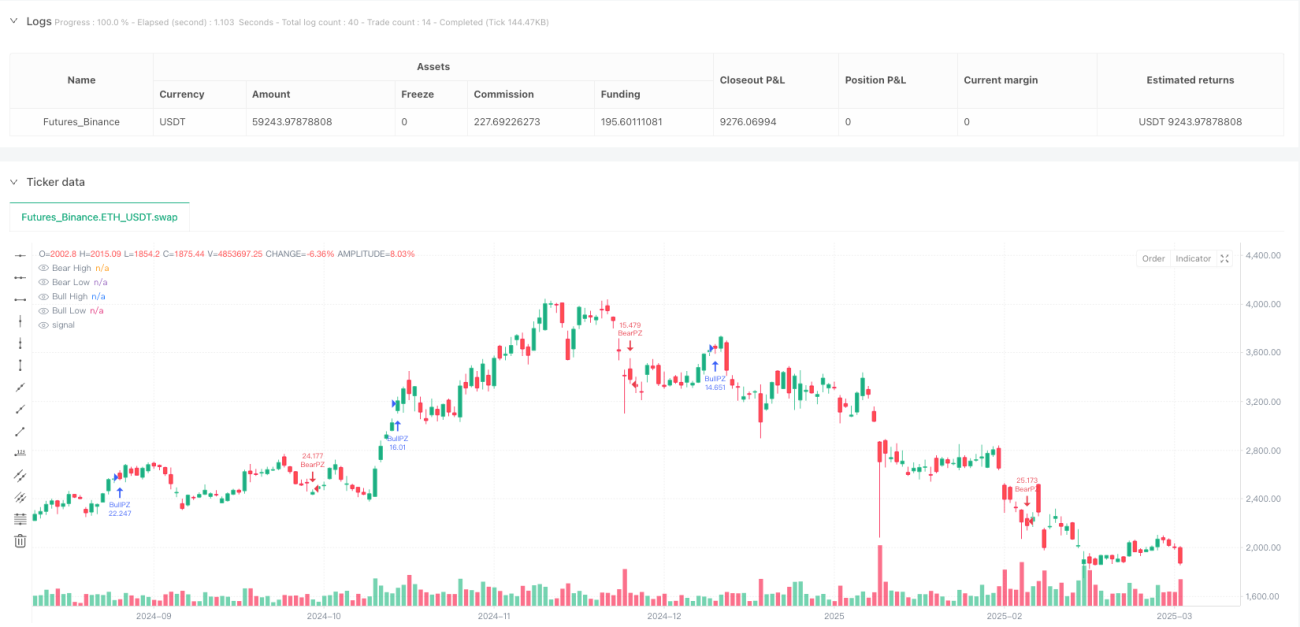
PowerZone تجارتی حکمت عملی ایک جدید خودکار طریقہ ہے جو مارکیٹ میں مضبوط قیمت کی حرکتوں کو پکڑنے پر توجہ مرکوز کرتا ہے۔ یہ حکمت عملی مخصوص قیمت کے علاقوں (جنہیں "PowerZones" کہا جاتا ہے) کی شناخت کرکے تاجروں کو داخل ہونے اور نکلنے کے واضح اشارے فراہم کرتی ہے، ساتھ ہی اس میں خطرے کے انتظام کا طریقہ کار بھی شامل ہے۔
حکمت عملی کا اصول
حکمت عملی کا مرکز دو اہم PowerZone اقسام کی شناخت پر ہے:
- بُلش PowerZone (Bullish PowerZone):
- شروع میں ایک بیئرش کینڈل (بند قیمت افتتاحی قیمت سے کم)
- اس کے بعد لگاتار کئی کینڈلز (بطور ڈیفالٹ 5) میں اضافے کا رجحان
- مجموعی قیمت کی تبدیلی ایک متعین حد (بطور ڈیفالٹ 2%) سے زیادہ
- بیئرش PowerZone (Bearish PowerZone):
- شروع میں ایک بُلش کینڈل (بند قیمت افتتاحی قیمت سے زیادہ)
- اس کے بعد لگاتار کئی کینڈلز میں کمی کا رجحان
- مجموعی قیمت کی تبدیلی متعین حد سے زیادہ
حکمت عملی کے فوائد
- رجحان کے موڑ کے خودکار شناخت
- پیرامیٹرز کی حسب ضرورت ترتیب کی لچک
- واضح بصری نمائش
- خودکار خطرے کا انتظام (نفع/نقصان کی حد)
- مختلف مارکیٹ ماحول کے لیے موزوں
- کوڈ مختصر، سمجھنے اور تبدیل کرنے میں آسان
حکمت عملی کے خطرات
- پیرامیٹرز کی غلط ترتیب سے حد سے زیادہ تجارت ہو سکتی ہے
- اتار چڑھاؤ والی مارکیٹ میں غلط اشارے پیدا ہو سکتے ہیں
- مقررہ پوزیشن سائز ایک تجارت میں نقصان کے خطرے کو بڑھا سکتا ہے
- پیچیدہ فلٹرنگ میکانزم کی کمی
- وسیع تر مارکیٹ کے رجحانات اور چکروں پر غور نہیں کیا گیا
حکمت عملی کی بہتری کے امکانات
-
اضافی فلٹرنگ شرائط شامل کرنا
- رجحان کے اشارے (جیسے EMA) کے ساتھ جوڑنا
- رفتار کے اشارے (جیسے RSI) کو مربوط کرنا
- حجم کی تصدیق کا طریقہ کار شامل کرنا
-
متحرک پوزیشن مینجمنٹ
- مارکیٹ کی اتار چڑھاؤ کے مطابق پوزیشن کا سائز ایڈجسٹ کرنا
- خطرے کے فیصد پر مبنی پوزیشن کنٹرول نافذ کرنا
-
متعدد ٹائم فریم کی تصدیق
- مختلف ٹائم فریموں پر اشاروں کی تصدیق کرنا
- اشاروں کی وشوسنییتا میں اضافہ
خلاصہ
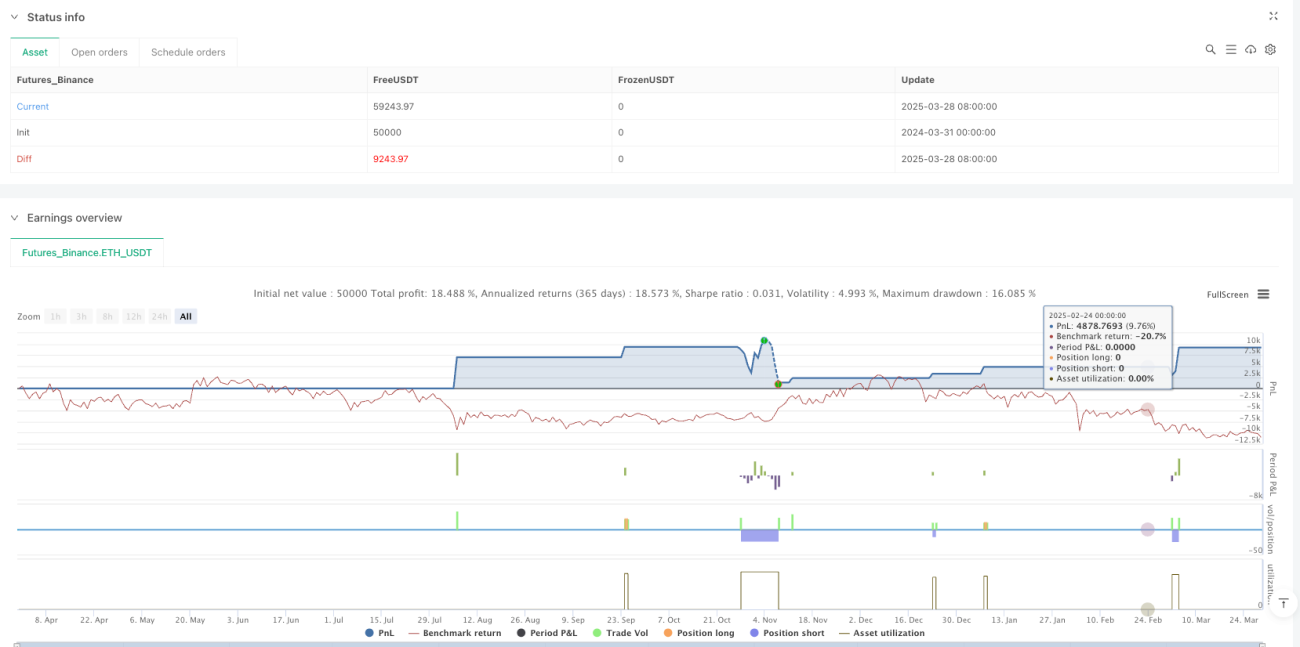
PowerZone تجارتی حکمت عملی قیمت کے مضبوط علاقوں کی منظم طریقے سے شناخت کرکے تاجروں کو ایک منظم تجارتی طریقہ فراہم کرتی ہے۔ اس کا بنیادی فائدہ خودکار، بصری اور لچکدار ہونا ہے، لیکن اس کے ساتھ پیرامیٹرز کو احتیاط سے ایڈجسٹ کرنا اور خطرے کے انتظام کے طریقہ کار کو مسلسل بہتر بنانا ضروری ہے۔
Source
Pine
/*backtest
start: 2024-03-31 00:00:00
end: 2025-03-29 08:00:00
period: 1d
basePeriod: 1d
exchanges: [{"eid":"Futures_Binance","currency":"ETH_USDT"}]
*/

// This Pine Script® code is subject to the terms of the Mozilla Public License 2.0 at https://mozilla.org/MPL/2.0/
// © tradingbauhaus

//@version=6Strategy parameters
Related strategies
Comment
All comments (0)
No data
- 1