
2
Follow
502
Followers
جائزہ
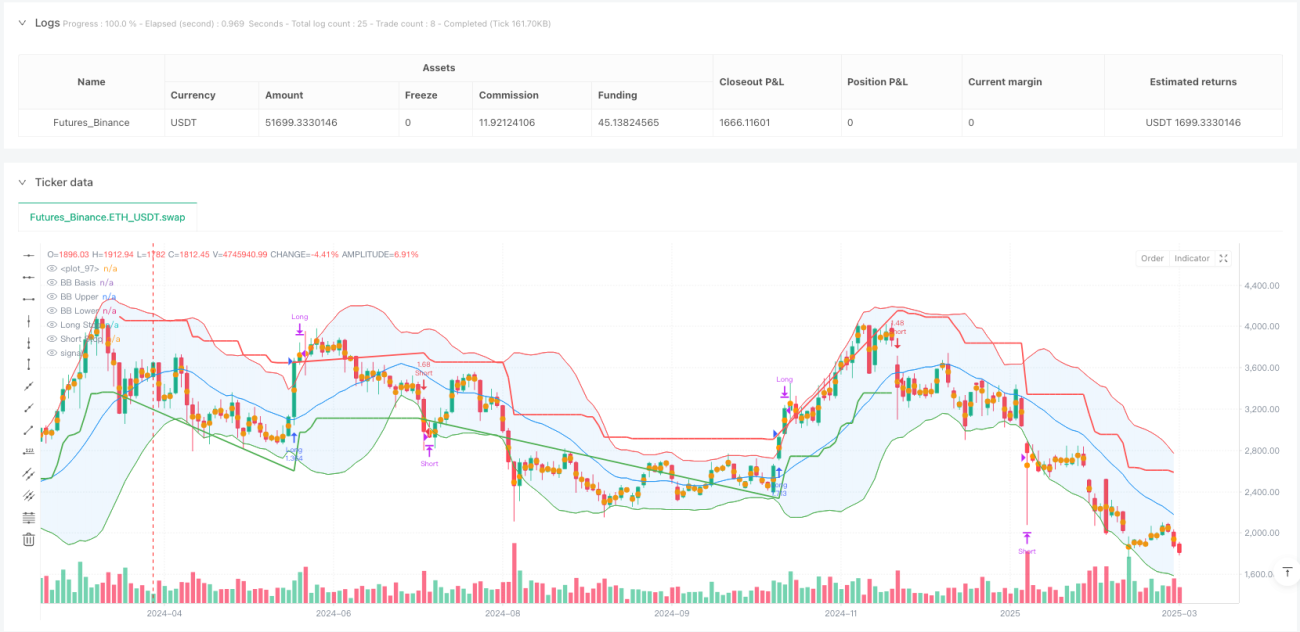
یہ مضمون ایک مشترکہ تجارتی حکمت عملی پیش کرتا ہے جو بولنگر بینڈز (Bollinger Bands) اور سپر ٹرینڈ (SuperTrend) انڈیکیٹر کو یکجا کرتی ہے۔ یہ حکمت عملی متعدد تکنیکی تجزیہ ٹولز کو شامل کرکے بازار میں داخلے اور خارج ہونے کے زیادہ درست سگنل فراہم کرنے کے ساتھ ساتھ تجارتی خطرے کو کم کرنے کا ہدف رکھتی ہے۔
حکمت عملی کا اصول
اس حکمت عملی کا بنیادی حصہ دو اہم اجزاء پر مشتمل ہے: بولنگر بینڈز (Bollinger Bands) اور سپر ٹرینڈ (SuperTrend) انڈیکیٹر۔
- بولنگر بینڈز کا حساب لگانے کا حصہ:
- بیس لائن کے لیے کنفیگر ایبل موونگ ایوریج (MA) کا استعمال
- معیاری انحراف کے ضرب کے مطابق اوپر اور نیچے کی پٹیاں تیار کرنا
- متعدد اقسام کی موونگ ایوریجز کی حمایت: سادہ موونگ ایوریج (SMA)، ایکسپونینشل موونگ ایوریج (EMA)، اسموتھڈ موونگ ایوریج (SMMA)، ویٹڈ موونگ ایوریج (WMA) اور والیوم ویٹڈ موونگ ایوریج (VWMA)
- سپر ٹرینڈ (SuperTrend) حصہ:
- اوسط حقیقی رینج (ATR) کا استعمال کرتے ہوئے سٹاپ لاس کا حساب
- مارکیٹ کی رجحان کی سمت کا متحرک تعین
- رجحان کی تبدیلی کے مطابق خرید و فروخت کے سگنل تیار کرنا
حکمت عملی کے فوائد
- متعدد انڈیکیٹرز کا مجموعہ: بولنگر بینڈز اور سپر ٹرینڈ کو ملا کر سگنل کی درستگی میں اضافہ
- لچکدار ترتیب: موونگ ایوریج کی قسم، پیرامیٹرز اور حساب کے طریقے کو حسب ضرورت تبدیل کیا جا سکتا ہے
- متحرک سٹاپ لاس: ATR پر مبنی سٹاپ لاس میکانزم خطرے کو مؤثر طریقے سے کنٹرول کر سکتا ہے
- بصری اضافہ: رجحان کی حالت بھرنے اور سگنل لیبلز فراہم کرتا ہے
- رسک مینجمنٹ: فی صد پوزیشن مینجمنٹ اور اہرام تجارت کی حدود مقرر کی گئی ہیں
حکمت عملی کے خطرات
- پیرامیٹر کی حساسیت: مختلف مارکیٹ حالات میں پیرامیٹرز کو کثرت سے ایڈجسٹ کرنے کی ضرورت پڑ سکتی ہے
- بیک ٹیسٹنگ کی حدود: تاریخی اعداد و شمار کی کارکردگی مستقبل کی مارکیٹ کارکردگی کی ضمانت نہیں دیتی
- لانگ/شارٹ سوئچنگ کا خطرہ: بار بار پوزیشن تبدیل کرنے سے تجارتی اخراجات بڑھ سکتے ہیں
- انڈیکیٹر کا تاخیر: تکنیکی انڈیکیٹرز میں سگنل میں کچھ تاخیر ہوتی ہے
حکمت عملی کی بہتری کی سمتیں
- پیرامیٹرز کو متحرک طور پر بہتر بنانے کے لیے مشین لرننگ الگورتھم متعارف کرانا
- اضافی فلٹرنگ شرائط شامل کرنا، جیسے والیوم کی تصدیق
- متعدد ٹائم فریم تصدیق کے طریقہ کار کی ترقی
- رسک مینجمنٹ ماڈیول کو بہتر بنانا اور زیادہ تفصیلی پوزیشن کنٹرول حکمت عملی متعارف کرانا
خلاصہ
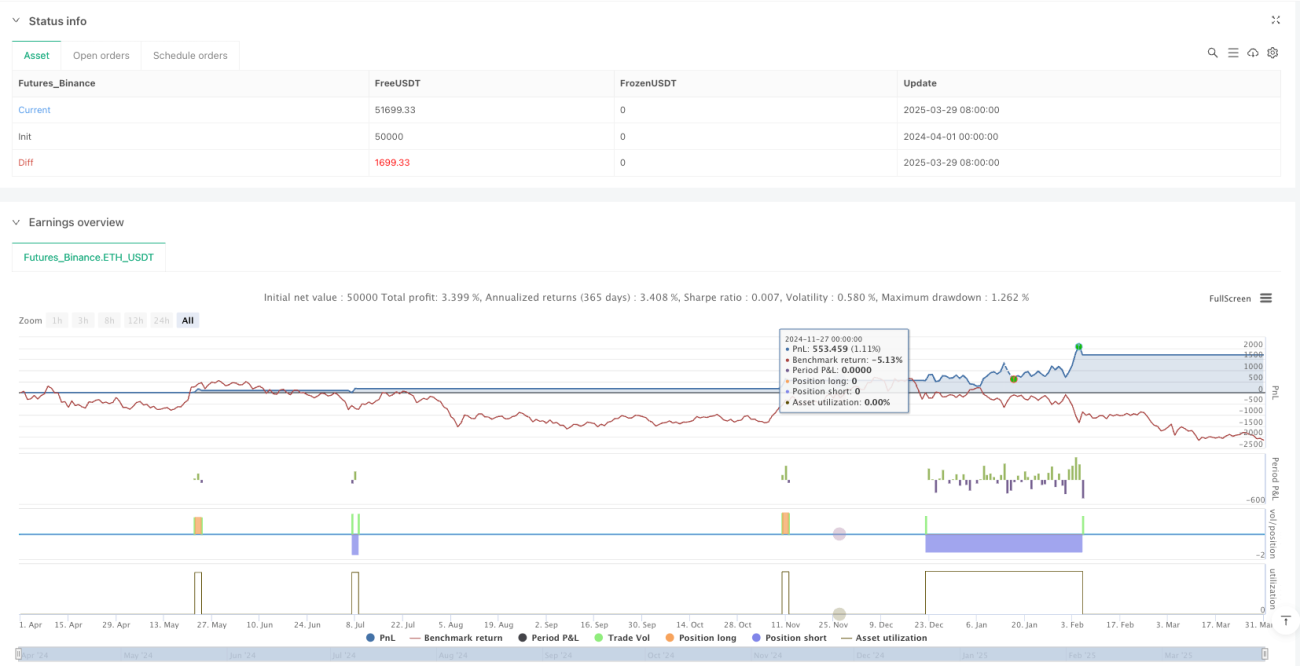
یہ ایک متعدد متحرک انڈیکیٹرز پر مشتمل تجارتی حکمت عملی ہے جو بولنگر بینڈز اور سپر ٹرینڈ کے امتزاج کے ذریعے ایک نسبتاً جامع تجارتی سگنل سسٹم فراہم کرتی ہے۔ حکمت عملی کا بنیادی مقصد سگنل کی درستگی اور رسک مینجمنٹ کے درمیان توازن قائم کرنا ہے، تاہم مختلف مارکیٹ حالات کے مطابق اسے مسلسل بہتر اور ایڈجسٹ کرنے کی ضرورت ہے۔
Source
Pine
/*backtest
start: 2024-04-01 00:00:00
end: 2025-03-31 00:00:00
period: 2d
basePeriod: 2d
exchanges: [{"eid":"Futures_Binance","currency":"ETH_USDT"}]
*/

//@version=6
strategy("Combined BB & New SuperTrend Strategy", overlay=true, initial_capital=100000, default_qty_type=strategy.percent_of_equity, default_qty_value=10, pyramiding=0)

//============================Strategy parameters
Related strategies
Comment
All comments (0)
No data
- 1