
[trans]
جائزہ
کثیر جہتی محوری نکات پر مبنی تجارتی حکمت عملی اور متحرک فیبوناچی انڈیکیٹر نظام ایک تکنیکی تجزیے پر مبنی تجارتی حکمت عملی ہے جو بنیادی طور پر دن کے اندر محوری نکات (Pivot Points)، مرکزی حد (CPR)، فیبوناچی ریٹریسمنٹ لیولز، حجمی وزنی اوسط قیمت (VWAP) اور متحرک اوسط (Moving Averages) جیسے متعدد اشاریوں کا استعمال کرتے ہوئے ممکنہ خرید و فروخت کے مواقع کی شناخت کرتی ہے۔ یہ حکمت عملی خاص طور پر 3 منٹ کی کندل (K-line) چارٹ پر مختصر مدت کی ٹریڈنگ کے لیے ڈے ٹریڈرز کے لیے موزوں ہے۔ حکمت عملی کا بنیادی مرکز اس بات کا تعین کرنا ہے کہ آیا مخصوص شرائط والی کندلیں کلیدی سپورٹ اور ریزسٹنس لیولز کو چھوتی ہیں، جس سے تجارتی سگنل متحرک ہوتے ہیں۔
یہ حکمت عملی یومیہ بلند ترین قیمت، کم ترین قیمت اور اختتامی قیمت پر مبنی محوری نکات کے نظام کو استعمال کرتی ہے، جس میں حجمی وزنی اوسط قیمت (VWAP) اور متحرک VWAP (MVWAP) کو متحرک سپورٹ اور ریزسٹنس حوالہ جات کے طور پر شامل کیا گیا ہے۔ اس کے ساتھ ساتھ، نسبتاً طاقت کے اشاریے (RSI)، سادہ متحرک اوسط (SMA) اور ایکسپونیشیل موونگ ایوریج (EMA) جیسے تکنیکی اشاریوں کے ذریعے، ایک جامع فیصلہ ساز نظام تشکیل دیا گیا ہے۔
حکمت عملی سب سے پہلے اہل سبز (تيزی والی) اور سرخ (مندی والی) کندلوں کی نشاندہی کرتی ہے، پھر یہ فیصلہ کرتی ہے کہ آیا یہ کندلیں کلیدی قیمت کی سطحوں جیسے محوری نکات، سپورٹ، ریزسٹنس یا VWAP وغیرہ کو چھوتی ہیں۔ جب سرخ کندل کلیدی قیمت کی سطح کو چھوتا ہے، تو خریداری کا سگنل (CE) متحرک ہوتا ہے؛ جب سبز کندل کلیدی قیمت کی سطح کو چھوتا ہے، تو فروخت کا سگنل (PE) متحرک ہوتا ہے۔ یہ الٹا سوچ (Reversal thinking) کلیدی قیمت کی سطحوں پر ممکنہ الٹ پلٹ کے نکات تلاش کرنے کے بنیادی تصور کی عکاسی کرتی ہے۔
حکمت عملی کا اصول
اس حکمت عملی کا اصول کلیدی سپورٹ اور ریزسٹنس لیولز کے ارد گرد قیمت کے اتار چڑھاؤ پر مبنی مارکیٹ کے رویے پر استوار ہے، جس میں کندل کی شکلوں، حجم اور مومینٹم انڈیکیٹرز کو تجارتی فیصلوں کے لیے استعمال کیا جاتا ہے۔ اصول کی تفصیل درج ذیل ہے:
-
کندل کی شناخت کا طریقہ کار:
- سبز کندل (تيزی): اختتامی قیمت افتتاحی قیمت سے زیادہ ہو، کندل کی باڈی کم از کم 17 پوائنٹس ہو، افتتاحی قیمت کم ترین قیمت کے ساتھ 0.382 گنا کندل کی حد سے کم ہو، اور اختتامی قیمت کم ترین قیمت کے ساتھ 0.682 گنا کندل کی حد سے زیادہ ہو۔
- سرخ کندل (مندی): اختتامی قیمت افتتاحی قیمت سے کم ہو، کندل کی باڈی کم از کم 17 پوائنٹس ہو۔
-
محوری نکات کا حساب کتاب کا نظام:
- یومیہ محوری نقطہ (PP): (یومیہ بلند ترین + یومیہ کم ترین + یومیہ اختتامی) / 3
- مزاحمتی سطحیں: R1، R2، R3، R4
- سپورٹ لیولز: S1، S2، S3، S4
- مرکزی حد (CPR): نچلے CPR اور اوپری CPR پر مشتمل ہے، جو قیمت کے ممکنہ طور پر مستحکم ہونے والے علاقے فراہم کرتا ہے۔
-
قیمت کا متحرک حوالہ:
- VWAP (حجمی وزنی اوسط قیمت): حجم کے عنصر کو مدنظر رکھنے کے بعد اوسط قیمت کی سطح کو ظاہر کرتا ہے۔
- MVWAP (متحرک حجمی وزنی اوسط قیمت): VWAP کی متحرک اوسط، جو قیمت کا ہموار حوالہ فراہم کرتی ہے۔
-
معاون انڈیکیٹر نظام:
- RSI: مارکیٹ میں زیادہ خرید یا زیادہ فروخت کی صورتحال کی پیمائش کے لیے استعمال ہوتا ہے۔
- SMA (50 دورانیہ) اور EMA (20 دورانیہ): قیمت کے رجحان کی سمت کا حوالہ فراہم کرتے ہیں۔
- حجم کا تجزیہ: 20 دورانیے کی حجم کی متحرک اوسط کے ذریعے حجم کے رجحان کا جائزہ لینا۔
-
تجارتی سگنل کی پیداوار:
- جب اہل سرخ کندل کسی بھی محوری نقطے، سپورٹ لیول، ریزسٹنس لیول یا VWAP/MVWAP کو چھوتا ہے، تو خریداری کا سگنل (CE) پیدا ہوتا ہے۔
- جب اہل سبز کندل کسی بھی محوری نقطے، سپورٹ لیول، ریزسٹنس لیول یا VWAP/MVWAP کو چھوتا ہے، تو فروخت کا سگنل (PE) پیدا ہوتا ہے۔
حکمت عملی کا بنیادی خیال کلیدی سپورٹ اور ریزسٹنس لیولز کے قریب قیمت کے ممکنہ الٹ پلٹ کو پکڑنا ہے، مخصوص کندل کی شکلوں اور متعدد تکنیکی اشاریوں کے ذریعے فلٹر کرکے سگنل کی تاثیر کو بڑھانا ہے۔ محوری نکات کو چھونے والی کندلیں اکثر اس بات کی نشاندہی کرتی ہیں کہ مارکیٹ ان کلیدی قیمت کی سطحوں پر تذبذب یا الٹ پلٹ کے امکانات کا مظاہرہ کر رہی ہے۔
حکمت عملی کے فوائد
حکمت عملی کے کوڈ کا گہرائی سے تجزیہ کرنے پر، ہم درج ذیل نمایاں فوائد کا خلاصہ کر سکتے ہیں:
-
کثیر جہتی تصدیقی طریقہ کار: متعدد تکنیکی اشاریوں (محوری نکات، VWAP، متحرک اوسط، RSI) کے امتزاج سے تجارتی سگنلز کی تصدیق کرتا ہے، جس سے جھوٹے سگنلز کا خطرہ کم ہوتا ہے۔
-
مارکیٹ کے مطابق متحرک موافقت: یومیہ محوری نکات کا نظام روزانہ اپ ڈیٹ ہوتا ہے، جو حکمت عملی کو مختلف مارکیٹ ماحول اور اتار چڑھاؤ کے مطابق ڈھالنے کی اجازت دیتا ہے۔
-
عین مطابق کندل کی شناخت: سخت کندل کی شکل کی شرائط اور فیبوناچی لیولز کے ذریعے ممکنہ تجارتی مواقع کو چھانٹ کر سگنل کے معیار کو بہتر بناتا ہے۔
-
لچکدار ڈسپلے سیٹنگز: حکمت عملی میں منظر کے مطابق ڈھالنے کی صلاحیت ہے، صرف مناسب ٹائم فریم (15 منٹ سے کم کے دن کے اندر چارٹ) پر محوری نکات دکھاتی ہے، چارٹ کی بے ترتیبی کو کم کرتی ہے۔
-
الٹی سوچ کا فائدہ: حکمت عملی سرخ کندل کے کلیدی مقام کو چھونے پر خریداری کے مواقع تلاش کرتی ہے، اور سبز کندل کے کلیدی مقام کو چھونے پر فروخت کے مواقع تلاش کرتی ہے، مارکیٹ کی ممکنہ قلیل مدتی زیادہ خرید یا زیادہ فروخت کی حالت کا فائدہ اٹھاتی ہے۔
-
مکمل قیمت کی سطحوں کا نظام: متعدد سپورٹ اور ریزسٹنس لیولز (S1-S4 اور R1-R4) پر مشتمل ہے، جو قیمت کے مختلف اتار چڑھاؤ والے مارکیٹ ماحول کے لیے بھرپور حوالہ فراہم کرتا ہے۔
-
مرکزی حد (CPR) کا انضمام: CPR دن کے اندر ممکنہ استحکام کے علاقے کی شناخت فراہم کرتا ہے، جو دن کے اندر ٹریڈنگ میں اہم حوالہ رکھتا ہے۔
-
بصری معاونت: بھرپور نشانات اور اشکال کے ذریعے، چارٹ پر اہل کندلوں اور کلیدی قیمت کو چھونے کی صورت حال کو واضح طور پر ظاہر کرتا ہے، جس سے تاجر کو تیزی سے شناخت کرنے میں آسانی ہوتی ہے۔
-
حجم کی تصدیق: حجم کے تجزیے کے ذریعے، حجم کی متحرک اوسط کے ذریعے مارکیٹ کی شرکت کا جائزہ لیتا ہے، سگنل کی وشوسنییتا کو بڑھاتا ہے۔
-
ڈے ٹریڈنگ کے لیے موزوں: حکمت عملی خاص طور پر مختصر وقت کے فریم (خاص طور پر 3 منٹ چارٹ) کے لیے ڈیزائن کی گئی ہے، جو دن کے اندر تاجروں کو مارکیٹ کے اتار چڑھاؤ کا استعمال کرتے ہوئے بار بار ٹریڈنگ کے لیے موزوں ہے۔
مندرجہ بالا فوائد اس حکمت عملی کو ایک جامع اور قابل اطلاق دن کے اندر تجارتی نظام بناتے ہیں، خاص طور پر ان سرمایہ کاروں کے لیے جنہیں تکنیکی تجزیے کا کچھ علم ہے اور جو قیمت کے رویے اور کلیدی قیمت کی سطحوں کی بنیاد پر تجارت کرنا چاہتے ہیں۔
حکمت عملی کے خطرات
اگرچہ اس حکمت عملی کے متعدد فوائد ہیں، لیکن اس کے ساتھ کچھ ممکنہ خطرات بھی وابستہ ہیں جن سے تاجر کو محتاط رہنا چاہیے:
-
زیادہ سگنل کا خطرہ: چونکہ حکمت عملی میں متعدد محوری نکات (PP, R1-R4, S1-S4) اور دیگر اشاریے شامل ہیں، اس لیے اتار چڑھاؤ والی مارکیٹ میں بہت زیادہ سگنلز پیدا ہو سکتے ہیں، جس سے بار بار تجارت اور فیسوں میں اضافہ ہوتا ہے۔
- حل: اضافی فلٹرنگ شرائط شامل کرنے پر غور کریں، جیسے تجارتی وقت کی پابندی یا رجحان کی تصدیق کی شرط۔
-
الٹی تجارت کا جال: حکمت عملی الٹی منطق پر مبنی ہے (سرخ کندل کلیدی مقام پر خریدنا، سبز کندل کلیدی مقام پر بیچنا)، مضبوط رجحان والی مارکیٹ میں مسلسل نقصان کا باعث بن سکتی ہے۔
- حل: حکمت عملی استعمال کرنے سے پہلے مجموعی مارکیٹ رجحان کا جائزہ لیں، مضبوط رجحان میں الٹی تجارت سے بچنے کے لیے رجحان فلٹر شامل کریں۔
-
پیرامیٹر کی حساسیت: حکمت عملی کی کارکردگی کندل کی شناخت کے پیرامیٹرز (جیسے کندل کی اونچائی 17 پوائنٹس سے زیادہ ہونی چاہیے) اور متحرک اوسط کے ادوار پر بہت زیادہ انحصار کرتی ہے، مختلف مارکیٹ ماحول میں مختلف پیرامیٹرز کی ضرورت ہو سکتی ہے۔
- حل: مختلف مصنوعات اور مارکیٹ حالات کے لیے بیک ٹیسٹنگ کریں، پیرامیٹرز کو بہتر بنائیں۔
-
اسٹاپ لاس میکانزم کی کمی: کوڈ میں واضح طور پر اسٹاپ لاس حکمت عملی طے نہیں کی گئی، جس کی وجہ سے ایک ہی تجارت میں بہت زیادہ نقصان ہو سکتا ہے۔
- حل: واضح اسٹاپ لاس حکمت عملی نافذ کریں، جیسے ATR پر مبنی متحرک اسٹاپ لاس یا مقررہ پوائنٹس اسٹاپ لاس۔
-
دن کے اندر حکمت عملی کی حدود: 3 منٹ کے چارٹ پر توجہ مرکوز کرنے والی دن کے اندر کی حکمت عملی کے طور پر، یہ درمیانی یا طویل مدتی رکھنے کے لیے موزوں نہیں ہے، طویل مدتی رجحان کے ممکنہ مواقع سے محروم ہو سکتی ہے۔
- حل: اس حکمت عملی کو تجارتی نظام کا ایک حصہ سمجھیں، درمیانی اور طویل مدتی حکمت عملیوں کے ساتھ استعمال کریں۔
-
محوری نکات کی حدود: سائیڈ ویز مارکیٹ میں، قیمت بار بار متعدد محوری نکات کو چھو سکتی ہے، جس سے الجھن پیدا ہو سکتی ہے۔
- حل: سائیڈ ویز مارکیٹ میں عارضی طور پر حکمت عملی بند کرنے یا سگنل کی تصدیق کی شرائط بڑھانے پر غور کریں۔
-
حجم کے وزن میں ایڈجسٹمنٹ کی کمی: اگرچہ VWAP استعمال کیا گیا ہے، لیکن حکمت عملی حجم کی بنیاد پر سگنل کے وزن کو متحرک طور پر ایڈجسٹ نہیں کرتی۔
- حل: حجم کی حد کی شرط شامل کریں، اس بات کو یقینی بنائیں کہ مارکیٹ میں کافی شرکت ہونے پر تجارت کی جائے۔
-
وقت پر انحصار: یومیہ محوری نکات پچھلے دن کے ڈیٹا پر مبنی ہوتے ہیں، نئے تجارتی دن کے آغاز پر اس دن کے کافی ڈیٹا کی کمی کی وجہ سے غیر مستحکم ہو سکتے ہیں۔
- حل: تجارتی دن شروع ہونے کے 30-60 منٹ بعد حکمت عملی کو فعال کرنے پر غور کریں، تاکہ کافی مارکیٹ معلومات حاصل ہو سکیں۔
-
خودکار عمل درآمد کے چیلنجز: حکمت عملی میں متعدد شرائط کا فیصلہ شامل ہے، حقیقت میں خودکار عمل درآمد میں تاخیر یا بروقت عمل درآمد کے مسائل ہو سکتے ہیں۔
- حل: عمل درآمد کے نظام کو بہتر بنائیں، کم تاخیر کو یقینی بنائیں، یا نیم خودکار طریقہ کار کے ساتھ انسانی تصدیق کو شامل کریں۔
-
بیک ٹیسٹنگ تعصب کا خطرہ: کوڈ میں سبز/سرخ کندل کی شناخت کی منطق بیک ٹیسٹنگ اور حقیقی تجارتی ماحول میں یکساں کارکردگی نہیں دکھا سکتی۔
- حل: سخت حقیقی نقلی ٹیسٹنگ کریں، اس بات کو یقینی بنائیں کہ حکمت عملی حقیقی تجارتی ماحول میں بھی مؤثر ہے۔
ان خطرات کو پہچاننا اور ان کا نظم کرنا اس حکمت عملی کو کامیابی سے استعمال کرنے کے لیے بہت ضروری ہے، تاجر کو اپنی خطرے برداشت کرنے کی صلاحیت اور تجارتی عادات کے مطابق مناسب ایڈجسٹمنٹ کرنی چاہیے۔
حکمت عملی کی بہتری کے رخ
کوڈ کے گہرائی سے تجزیے کی بنیاد پر، یہ وہ اہم رخ ہیں جن پر اس حکمت عملی کو بہتر بنایا جا سکتا ہے:
-
متحرک کندل شناخت پیرامیٹرز:
- موجودہ حکمت عملی مؤثر کندلوں کی شناخت کے لیے مقررہ اقدار (جیسے کندل کی اونچائی کم از کم 17 پوائنٹس) استعمال کرتی ہے، انہیں ATR (اوسط حقیقی حد) پر مبنی متحرک پیرامیٹرز میں تبدیل کیا جا سکتا ہے، تاکہ حکمت عملی مختلف اتار چڑھاؤ والے ماحول میں بہتر طور پر ڈھل سکے۔
- بہتری کی وجہ: مقررہ پیرامیٹرز مختلف اتار چڑھاؤ والے ماحول میں کارکردگی میں بہت فرق ظاہر کرتے ہیں، متحرک پیرامیٹرز حکمت عملی کی مطابقت کو بڑھا سکتے ہیں۔
-
رجحان فلٹرنگ سسٹم:
- اعلیٰ ٹائم فریم (جیسے 15 منٹ یا 30 منٹ) پر رجحان کا تعین شامل کریں، صرف مرکزی رجحان کی سمت میں تجارت کریں یا سگنل کے وزن کو ایڈجسٹ کریں۔
- بہتری کی وجہ: مضبوط رجحان میں بار بار الٹی تجارت سے بچنا، جیت کی شرح اور منافع/نقصان کے تناسب کو بہتر بنانا۔
-
سگنل کوالٹی اسکورنگ میکانزم:
- ہر تجارتی سگنل کے لیے ایک جامع اسکورنگ سسٹم قائم کریں، جس میں متعدد عوامل جیسے کندل کی طاقت، چھونے والے محوری نقطے کی اہمیت، RSI قدر، حجم میں غیر معمولی تبدیلی وغیرہ شامل ہوں۔
- بہتری کی وجہ: تمام سگنلز کا معیار یکساں نہیں ہوتا، اسکورنگ سسٹم کم معیار کے سگنلز کو فلٹر کر سکتا ہے، تجارتی کارکردگی کو بہتر بنا سکتا ہے۔
-
سرمایہ کے انتظام کا انضمام:
- سگنل کی طاقت اور مارکیٹ کے حالات کے مطابق پوزیشن کے سائز کو متحرک طور پر ایڈجسٹ کریں، زیادہ امکان والے مواقع پر پوزیشن بڑھائیں، کم امکان والے حالات میں خطرے کی نمائش کم کریں۔
- بہتری کی وجہ: مؤثر سرمایہ کا انتظام طویل مدتی منافع کے لیے بہت اہم ہے، حکمت عملی کی کارکردگی کو نمایاں طور پر بہتر بنا سکتا ہے۔
-
متعدد ٹائم فریم کی تصدیق:
- سگنل پیدا کرنے سے پہلے متعدد ٹائم فریموں پر حالات کی مطابقت کی جانچ کریں، مثال کے طور پر جب 3 منٹ اور 15 منٹ کے چارٹ پر سگنل ایک جیسے ہوں تو تجارت کریں۔
- بہتری کی وجہ: متعدد ٹائم فریم کی تصدیق غلط سگنلز کے امکان کو کم کر سکتی ہے، تجارتی درستگی کو بڑھا سکتی ہے۔
-
اسٹاپ لاس اور ٹیک پرافٹ میکانزم:
- ذہین اسٹاپ لاس سسٹم نافذ کریں، جیسے اتار چڑھاؤ پر مبنی متحرک اسٹاپ لاس یا کلیدی ڈھانچے کی پوزیشنوں پر اسٹاپ لاس، اس کے ساتھ خودکار ٹیک پرافٹ اہداف مقرر کریں۔
- بہتری کی وجہ: خطرے کا مکمل انتظام بڑی کمیوں سے بچنے اور منافع کے تحفظ کے لیے بہت ضروری ہے۔
-
تجارتی وقت کا فلٹر:
- مؤثر اور غیر مؤثر تجارتی اوقات کی شناخت کریں، کم اتار چڑھاؤ یا الجھن والے اوقات (جیسے دوپہر کے کھانے کا وقت یا مارکیٹ کھلنے اور بند ہونے کے اوقات) سے گریز کریں۔
- بہتری کی وجہ: مختلف اوقات میں مارکیٹ کے رویے کی خصوصیات مختلف ہوتی ہیں، انتخابی تجارت مجموعی کارکردگی کو بہتر بنا سکتی ہے۔
-
خودکار موافق انڈیکیٹر پیرامیٹرز:
- مقررہ تکنیکی انڈیکیٹر پیرامیٹرز (جیسے RSI کے 14 دورانیہ، EMA کے 20 دورانیہ) کو مارکیٹ کی حالت کی بنیاد پر خودکار طور پر ایڈجسٹ ہونے والے پیرامیٹرز میں تبدیل کریں۔
- بہتری کی وجہ: جب مارکیٹ کے حالات تبدیل ہوتے ہیں، بہترین انڈیکیٹر پیرامیٹرز کو بھی اسی کے مطابق ایڈجسٹ کیا جانا چاہیے، تاکہ انڈیکیٹر کی حساسیت میں اضافہ ہو۔
-
مارکیٹ ماحول کی درجہ بندی:
- خودکار الگورتھم شامل کریں جو موجودہ مارکیٹ ماحول (رجحان، استحکام، زیادہ اتار چڑھاؤ وغیرہ) کو پہچانے، اور مختلف ماحول کے لیے مختلف پیرامیٹر سیٹنگز استعمال کرے۔
- بہتری کی وجہ: ایک ہی پیرامیٹر سیٹنگ تمام مارکیٹ ماحول میں بہترین کارکردگی نہیں دکھا سکتی، ماحول کے مطابق ایڈجسٹمنٹ حکمت عملی کے استحکام کو نمایاں طور پر بڑھا سکتی ہے۔
-
مشین لرننگ میں اضافہ:
- سگنل کی کامیابی کے امکانات کی پیش گوئی کرنے کے لیے مشین لرننگ ماڈلز کو شامل کرنے پر غور کریں، تاریخی نمونوں کی شناخت کی بنیاد پر ٹریڈنگ سگنلز کو فلٹر اور ترجیح دیں۔
- بہتری کی وجہ: مشین لرننگ ایسے پیچیدہ نمونوں کو دریافت کر سکتی ہے جنہیں دستی طور پر پہچاننا مشکل ہے، جس سے حکمت عملی کی ذہانت کی سطح بڑھتی ہے۔
مندرجہ بالا بہتری کی سمتوں پر عمل درآمد کر کے، یہ حکمت عملی اپنے اصل فوائد کو برقرار رکھتے ہوئے، موافقت، درستگی اور طویل مدتی منافع میں نمایاں بہتری لا سکتی ہے، اور مختلف مارکیٹ کی حالتوں کے چیلنجوں کا بہتر طور پر مقابلہ کر سکتی ہے۔
خلاصہ
ملٹی ڈائمینشنل پیوٹ پوائنٹ ٹریڈنگ اسٹریٹیجی اور ڈائنامک فبونیکی انڈیکیٹر سسٹم ایک جامع اور منظم انٹرا ڈے ٹریڈنگ اسٹریٹیجی سسٹم ہے۔ یہ روایتی تکنیکی تجزیہ کے اوزاروں (پیوٹ پوائنٹ، فبونیکی ریٹیسمنٹ، موونگ ایوریجز) کو جدید ڈائنامک انڈیکیٹرز (VWAP، CPR) کے ساتھ ہوشیاری سے جوڑتا ہے، اور سخت کینڈل شرائط کی فلٹرنگ اور متعدد انڈیکیٹرز کی تصدیق کے ذریعے تاجروں کو ایک ممکنہ انٹرا ڈے ٹریڈنگ فریم ورک فراہم کرتا ہے۔
اس حکمت عملی کا بنیادی فائدہ اہم قیمت کی سطحوں کا مکمل احاطہ اور ممکنہ ریورسل پوائنٹس کی حساس گرفت میں ہے۔ سخت کینڈل شناخت کی شرائط طے کر کے، حکمت عملی بے معنی مارکیٹ کے شور کو فلٹر کر کے اعلی امکانی ٹریڈنگ مواقع پر توجہ مرکوز کرنے کے قابل ہوتی ہے۔ اس کے ساتھ ساتھ، والیوم اور مومینٹم انڈیکیٹرز کے استعمال سے سگنلز کی قابل اعتمادی میں مزید اضافہ ہوتا ہے۔
تاہم، اس حکمت عملی میں کچھ حدود بھی ہیں، جیسے زیادہ سگنلز کا امکان، الٹی ٹریڈنگ کا خطرہ، اور پیرامیٹرز کی اصلاح کے چیلنجز۔ ان مسائل کے حل کے لیے، ہم نے متعدد بہتری کی سمتیں تجویز کی ہیں، جن میں ڈائنامک پیرامیٹر ایڈجسٹمنٹ، ملٹی ٹائم فریم کنفرمیشن، ذہین منی مینجمنٹ، اور مارکیٹ کے ماحول کی موافقت شامل ہیں۔ یہ بہتری تاجروں کو اپنی ضروریات اور مارکیٹ کی خصوصیات کے مطابق حکمت عملی کو ایڈجسٹ کرنے اور مجموعی ٹریڈنگ نتائج کو بہتر بنانے میں مدد دے سکتی ہیں۔
یہ نوٹ کرنا ضروری ہے کہ کوئی بھی ٹریڈنگ اسٹریٹیجی "پتھر کو سونے میں بدلنے" کا آلہ نہیں ہے۔ کامیاب ٹریڈنگ کا انحصار حکمت عملی کے علاوہ تاجر کے صبر، نظم و ضبط اور مسلسل سیکھنے پر بھی ہوتا ہے۔ اس حکمت عملی کے لیے، تاجروں کو مشورہ دیا جاتا ہے کہ وہ پہلے نقلی ماحول میں اسے اچھی طرح آزمائیں، مختلف مارکیٹ کے حالات میں اس کی کارکردگی کی خصوصیات سے واقف ہوں، اور بتدریج پیرامیٹرز کو مخصوص ٹریڈنگ مصنوعات اور اپنے ذاتی انداز کے مطابق ایڈجسٹ کریں، تاکہ آخر کار ایک ذاتی نوعیت کا اور پائیدار منافع بخش ٹریڈنگ سسٹم تشکیل پائے۔
مسلسل مشق، فیڈ بیک اور بہتری کے ذریعے، ملٹی ڈائمینشنل پیوٹ پوائنٹ ٹریڈنگ اسٹریٹیجی اور ڈائنامک فبونیکی انڈیکیٹر سسٹم انٹرا ڈے تاجروں کے ٹول باکس میں ایک طاقتور ہتھیار بن سکتا ہے، جو انٹرا ڈے مارکیٹ کی اتار چڑھاؤ کو سمجھنے کے لیے ایک قابل اعتماد تکنیکی تجزیہ فریم ورک فراہم کرتا ہے۔
- تجارتی سگنل کی تخلیق:
- جب قابلیت رکھنے والی سرخ موم بتیاں کسی بھی پیوٹ پوائنٹ، سپورٹ لیول، ریزسٹنس لیول، یا VWAP/MVWAP کو چھوتی ہیں، تو خریداری کا سگنل (CE) پیدا ہوتا ہے۔
- جب قابلیت رکھنے والی سبز موم بتیاں کسی بھی پیوٹ پوائنٹ، سپورٹ لیول، ریزسٹنس لیول، یا VWAP/MVWAP کو چھوتی ہیں، تو فروخت کا سگنل (PE) پیدا ہوتا ہے۔
حکمت عملی کا بنیادی خیال اہم سپورٹ اور ریزسٹنس لیولز کے قریب ممکنہ ریورسلز کو پکڑنا ہے، جنہیں مخصوص موم بتی کے نمونوں اور متعدد تکنیکی اشارے کے ذریعے فلٹر کیا جاتا ہے تاکہ سگنل کی درستگی بڑھ سکے۔ پیوٹ پوائنٹ کو چھونے والی موم بتیاں اکثر ان اہم قیمت کی سطحوں پر مارکیٹ میں تذبذب یا ریورسل کے بڑھتے ہوئے امکان کی نمائندگی کرتی ہیں۔
حکمت عملی کے فوائد
حکمت عملی کوڈ کے گہرے تجزیے سے درج ذیل اہم فوائد سامنے آتے ہیں:
-
ملٹی ڈائمینشنل تصدیقی طریقہ کار: تجارتی سگنلز کی تصدیق کے لیے متعدد تکنیکی اشارے (پیوٹ پوائنٹس، VWAP، موونگ ایوریجز، RSI) کو یکجا کرتا ہے، جس سے غلط سگنل کا خطرہ کم ہوتا ہے۔
-
متحرک مارکیٹ موافقت: روزانہ پیوٹ پوائنٹ سسٹم روزانہ اپ ڈیٹ ہوتا ہے، جس سے حکمت عملی مختلف مارکیٹ ماحول اور اتار چڑھاؤ کے مطابق ڈھل سکتی ہے۔
-
درست موم بتی کی شناخت: سخت موم بتی کے نمونوں اور فبونیکی سطحوں کے ذریعے ممکنہ تجارتی مواقع کو اسکرین کرتا ہے، جس سے سگنل کے معیار میں بہتری آتی ہے۔
-
لچکدار ڈسپلے سیٹنگز: حکمت عملی میں ویو ایڈاپٹیشن کی خصوصیت ہے، جو صرف مناسب ٹائم فریمز (15 منٹ سے نیچے کے انٹراڈے چارٹس) میں پیوٹ پوائنٹس دکھاتی ہے، چارٹ کی بے ترتیبی کو کم کرتی ہے۔
-
مخالفانہ سوچ کا فائدہ: حکمت عملی ان مواقع پر خریداری کے مواقع تلاش کرتی ہے جب سرخ موم بتیاں اہم سطحوں کو چھوتی ہیں، اور فروخت کے مواقع جب سبز موم بتیاں اہم سطحوں کو چھوتی ہیں، مارکیٹ کے ممکنہ قلیل مدتی اوور بوٹ/اوور سیلڈ حالات سے فائدہ اٹھاتے ہوئے۔
-
مکمل قیمت کی سطح کا درجہ بندی: سپورٹ اور ریزسٹنس کی متعدد سطحیں (S1-S4 اور R1-R4) شامل ہیں، جو مختلف اتار چڑھاؤ کی حدود والے مارکیٹ ماحول کے لیے موزوں قیمت کے حوالہ جات فراہم کرتی ہیں۔
-
مرکزی پیوٹ رینج (CPR) کا انضمام: CPR دن کے لیے ممکنہ استحکام کے علاقوں کی شناخت فراہم کرتا ہے، جس کی انٹراڈے ٹریڈنگ میں اہم اہمیت ہے۔
-
بصری معاونت: بھرپور مارکرز اور اشکال کے ذریعے، اہل موم بتیوں اور اہم قیمت کی سطحوں کو چھونے والی مثالوں کو چارٹ پر واضح طور پر نشان زد کیا جاتا ہے، جس سے تاجر انہیں فوری طور پر پہچان سکتے ہیں۔
-
والیوم کی تصدیق: والیوم کے تجزیے کو شامل کرتا ہے، والیوم موونگ ایوریج کے ذریعے مارکیٹ کی شرکت کا جائزہ لیتا ہے، سگنل کی وشوسنییتا کو بڑھاتا ہے۔
-
انٹراڈے ٹریڈنگ کے لیے موزوں: حکمت عملی خاص طور پر مختصر ٹائم فریمز (خاص طور پر 3 منٹ کے چارٹس) کے لیے ڈیزائن کی گئی ہے، جو انٹراڈے تاجروں کے لیے موزوں ہے جو بار بار تجارت کے ذریعے مارکیٹ کے اتار چڑھاؤ سے فائدہ اٹھانا چاہتے ہیں۔
یہ فوائد اس حکمت عملی کو ایک مضبوط، موافقت پذیر انٹراڈے ٹریڈنگ سسٹم بناتے ہیں، خاص طور پر ان سرمایہ کاروں کے لیے جن کی تکنیکی تجزیے کی اچھی سمجھ ہے اور جو قیمت کی حرکت اور اہم قیمت کی سطحوں کی بنیاد پر تجارت کرنا چاہتے ہیں۔
حکمت عملی کے خطرات
اپنے بے شمار فوائد کے باوجود، حکمت عملی میں کچھ ممکنہ خطرات بھی ہیں جن پر تاجروں کو احتیاط سے توجہ دینی چاہیے:
-
ضرورت سے زیادہ سگنل کا خطرہ: حکمت عملی میں متعدد پیوٹ پوائنٹس (PP, R1-R4, S1-S4) اور دیگر اشارے شامل ہونے کی وجہ سے، متزلزل مارکیٹوں میں یہ بہت زیادہ سگنل پیدا کر سکتی ہے، جس سے بار بار تجارت اور فیسوں میں اضافہ ہوتا ہے۔
- حل: اضافی فلٹرنگ شرائط شامل کرنے پر غور کریں، جیسے تجارتی سیشن کی حدود یا رجحان کی تصدیق کی شرائط۔
-
مخالفانہ تجارت کا جال: حکمت عملی مخالفانہ منطق پر مبنی ہے (سرخ موم بتیوں پر خریدنا جب وہ اہم سطحوں کو چھوتی ہیں، سبز موم بتیوں پر بیچنا جب وہ اہم سطحوں کو چھوتی ہیں)، جو مضبوط رجحانی مارکیٹوں میں لگاتار نقصان کا سبب بن سکتی ہے۔
- حل: حکمت عملی استعمال کرنے سے پہلے مجموعی مارکیٹ رجحان کا اندازہ لگائیں، اور مضبوط رجحانات میں رجحان کے خلاف تجارت سے بچنے کے لیے رجحان فلٹر شامل کریں۔
-
پیرامیٹر کی حساسیت: حکمت عملی کی تاثیر موم بتی کی شناخت کے پیرامیٹرز (مثلاً موم بتی کی اونچائی کم از کم 17 پوائنٹس ہونی چاہیے) اور موونگ ایوریج کے دورانیے کی ترتیبات پر بہت زیادہ انحصار کرتی ہے، جن کے لیے مختلف بازاروں کے ماحول میں مختلف پیرامیٹرز کی ضرورت پڑ سکتی ہے۔
- حل: مختلف آلات اور بازار کے حالات پر بیک ٹیسٹ کریں تاکہ پیرامیٹر کی ترتیبات کو بہتر بنایا جا سکے۔
-
اسٹاپ لاس میکانزم کی کمی: کوڈ میں کوئی واضح اسٹاپ لاس حکمت عملی طے نہیں کی گئی، جس کی وجہ سے ایک ہی تجارت میں زیادہ نقصان ہو سکتا ہے۔
- حل: واضح اسٹاپ لاس حکمت عملیاں نافذ کریں، جیسے اے ٹی آر پر مبنی متحرک اسٹاپ لاس یا فکسڈ پوائنٹ اسٹاپ لاس۔
-
انٹرا ڈے حکمت عملی کی حدود: 3 منٹ کے چارٹ پر توجہ مرکوز کرنے والی اس حکمت عملی کے طور پر، یہ درمیانی یا طویل مدتی ہولڈنگ کے لیے موزوں نہیں ہے، اور طویل مدتی رجحانات میں مواقع ضائع ہو سکتے ہیں۔
- حل: اس حکمت عملی کو تجارتی نظام کے ایک حصے کے طور پر دیکھیں، اور درمیانی اور طویل مدتی حکمت عملیوں کے ساتھ مل کر استعمال کریں۔
-
محوری نقطوں کی حدود: رینج باؤنڈ مارکیٹوں میں، قیمت بار بار ایک سے زیادہ محوری نقطوں کو چھو سکتی ہے، جس سے مبہم سگنل پیدا ہو سکتے ہیں۔
- حل: کنسولیڈیٹنگ مارکیٹوں میں حکمت عملی کو عارضی طور پر غیر فعال کرنے یا سگنل کی تصدیق کی شرائط شامل کرنے پر غور کریں۔
-
حجم کے وزن میں ایڈجسٹمنٹ کی کمی: اگرچہ وی ڈبلیو اے پی استعمال کیا جاتا ہے، لیکن حکمت عملی حجم کے سائز کی بنیاد پر سگنل کے وزن کو متحرک طور پر ایڈجسٹ نہیں کرتی۔
- حل: حجم کی حد کی شرائط شامل کریں تاکہ تجارت صرف کافی مارکیٹ کی شرکت کے ساتھ کی جائے۔
-
وقت پر انحصار: روزانہ کے محوری نقطے پچھلے دن کے اعداد و شمار پر مبنی ہوتے ہیں، اور نئے تجارتی دن کے آغاز پر موجودہ دن کے اعداد و شمار کی ناکافی وجہ سے غیر مستحکم کارکردگی دکھا سکتے ہیں۔
- حل: تجارتی دن شروع ہونے کے 30-60 منٹ بعد حکمت عملی کو فعال کرنے پر غور کریں تاکہ کافی مارکیٹ کی معلومات جمع ہو سکیں۔
-
آٹومیشن کے نفاذ کے چیلنجز: حکمت عملی میں متعدد شرائط کے فیصلے شامل ہیں، اور حقیقی خودکار عمل درآمد کے دوران تاخیر یا بروقت عمل نہ ہونے کا سامنا ہو سکتا ہے۔
- حل: عمل درآمد کے نظام کو بہتر بنائیں تاکہ کم لیٹنسی یقینی ہو، یا دستی تصدیق کے ساتھ نیم خودکار طریقوں پر غور کریں۔
-
بیک ٹیسٹ بایاس کا خطرہ: کوڈ میں سبز/سرخ موم بتی کی شناخت کی منطق بیک ٹیسٹنگ اور لائیو ٹریڈنگ کے ماحول میں مختلف کارکردگی دکھا سکتی ہے۔
- حل: سخت لائیو سمولیشن ٹیسٹنگ کریں تاکہ یہ یقینی ہو سکے کہ حکمت عملی حقیقی تجارتی ماحول میں موثر رہے۔
اس حکمت عملی کو کامیابی سے لاگو کرنے کے لیے ان خطرات کو پہچاننا اور ان کا انتظام کرنا بہت ضروری ہے۔ تاجروں کو اپنی خطرہ برداشت کی صلاحیت اور تجارتی عادات کی بنیاد پر مناسب ایڈجسٹمنٹ کرنی چاہیے۔
حکمت عملی کو بہتر بنانے کی سمتیں
کوڈ کے گہرے تجزیے کی بنیاد پر، اس حکمت عملی کو بہتر بنانے کے لیے درج ذیل اہم سمتیں ہیں:
-
متحرک موم بتی شناخت کے پیرامیٹرز:
- موجودہ حکمت عملی مؤثر موم بتیوں کی شناخت کے لیے مقررہ اقدار (جیسے موم بتی کی اونچائی کم از کم 17 پوائنٹس) استعمال کرتی ہے۔ اسے اے ٹی آر (اوسط حقیقی رینج) پر مبنی متغیر پیرامیٹرز میں تبدیل کیا جا سکتا ہے تاکہ مختلف اتار چڑھاؤ کے ماحول میں بہتر طور پر ڈھل سکے۔
- بہتری کی دلیل: مقررہ پیرامیٹرز مختلف اتار چڑھاؤ کے ماحول میں مختلف کارکردگی دکھاتے ہیں؛ متحرک پیرامیٹرز حکمت عملی کی موافقت کو بہتر بنا سکتے ہیں۔
-
رجحان فلٹرنگ سسٹم:
- زیادہ ٹائم فریموں (جیسے 15 منٹ یا 30 منٹ) سے رجحان کا تعین شامل کریں تاکہ صرف اہم رجحان کی سمت میں تجارت کی جا سکے یا سگنل کے وزن کو ایڈجسٹ کیا جا سکے۔
- بہتری کی دلیل: مضبوط رجحانات میں بار بار مخالف رجحان کی تجارت سے بچیں، جیت کی شرح اور خطرے سے منافع کے تناسب کو بہتر بنائیں۔
-
سگنل کوالٹی اسکورنگ میکانزم:
- ہر تجارتی سگنل کے لیے ایک جامع اسکورنگ سسٹم قائم کریں، جس میں متعدد عوامل جیسے موم بتی کی طاقت، چھوئے گئے محوری نقطے کی اہمیت، آر ایس آئی کی قدر، حجم کی بے قاعدگی وغیرہ پر غور کیا جائے۔
- بہتری کی دلیل: تمام سگنلز یکساں معیار کے نہیں ہوتے؛ اسکورنگ سسٹم کم معیار کے سگنلز کو فلٹر کر سکتا ہے اور تجارتی کارکردگی کو بہتر بنا سکتا ہے۔
-
سرمایہ کے انتظام کا انضمام:
- سگنل کی طاقت اور مارکیٹ کے حالات کی بنیاد پر پوزیشن کے سائز کو متحرک طور پر ایڈجسٹ کریں، زیادہ امکان والے مواقع پر پوزیشنیں بڑھائیں اور کم امکان والی صورتوں میں خطرے کی نمائش کو کم کریں۔
- بہتری کی وجہ: مؤثر سرمایہ کا انتظام طویل مدتی منافع کے لیے اہم ہے اور حکمت عملی کی کارکردگی کو نمایاں طور پر بہتر بنا سکتا ہے۔
-
متعدد ٹائم فریم کی تصدیق:
- سگنلز پیدا کرنے سے پہلے متعدد ٹائم فریموں پر شرائط کی مستقل مزاجی کو چیک کریں، مثال کے طور پر، صرف اس وقت تجارت کریں جب 3 منٹ اور 15 منٹ کے چارٹ کے سگنل مطابقت رکھتے ہوں۔
- بہتری کی وجہ: متعدد ٹائم فریم کی تصدیق غلط سگنلز کے امکان کو کم کر سکتی ہے اور تجارتی درستگی کو بہتر بنا سکتی ہے۔
-
اسٹاپ لاس اور ٹیک پرافٹ میکانزم:
- ذہین اسٹاپ لاس سسٹمز نافذ کریں، جیسے کہ اتار چڑھاؤ پر مبنی متحرک اسٹاپ لاس یا کلیدی ساختی پوزیشن اسٹاپ لاس، اور خودکار ٹیک پرافٹ اہداف مقرر کریں۔
- بہتری کی وجہ: مضبوط رسک مینجمنٹ بڑی کمی سے بچنے اور منافع کی حفاظت کے لیے اہم ہے۔
-
تجارتی وقت کے فلٹرز:
- موثر اور غیر موثر تجارتی سیشنز کی نشاندہی کریں، کم اتار چڑھاؤ یا افراتفری کے ادوار (جیسے دوپہر کے کھانے کے اوقات یا مارکیٹ کھلنے اور بند ہونے سے پہلے اور بعد) سے گریز کریں۔
- بہتری کی وجہ: مختلف سیشنز میں مارکیٹ کے رویے کی خصوصیات مختلف ہوتی ہیں؛ انتخابی تجارت مجموعی کارکردگی کو بہتر بنا سکتی ہے۔
-
انڈیکیٹر کے موافق پیرامیٹرز:
- فکسڈ تکنیکی انڈیکیٹر پیرامیٹرز (جیسے 14-پیریڈ RSI، 20-پیریڈ EMA) کو ان پیرامیٹرز میں تبدیل کریں جو مارکیٹ کی حالت کی بنیاد پر خود بخود ایڈجسٹ ہوتے ہیں۔
- بہتری کی وجہ: جب مارکیٹ کے حالات تبدیل ہوتے ہیں، تو بہترین انڈیکیٹر پیرامیٹرز بھی اسی کے مطابق تبدیل ہونے چاہئیں، تاکہ انڈیکیٹر کی حساسیت بہتر ہو۔
-
مارکیٹ کے ماحول کی درجہ بندی:
- موجودہ مارکیٹ کے ماحول (رجحان ساز، مستحکم، زیادہ اتار چڑھاؤ وغیرہ) کی خود بخود شناخت کرنے کے لیے الگورتھم شامل کریں اور مختلف ماحول کے لیے مختلف پیرامیٹر سیٹنگز لاگو کریں۔
- بہتری کی وجہ: سنگل پیرامیٹر سیٹنگز تمام مارکیٹ ماحول میں بہترین کارکردگی کا مظاہرہ کرنا مشکل ہیں؛ ماحول کے مطابق ایڈجسٹمنٹ حکمت عملی کے استحکام کو نمایاں طور پر بڑھا سکتی ہیں۔
-
مشین لرننگ میں اضافہ:
- سگنل کی کامیابی کے امکان کی پیش گوئی کرنے کے لیے مشین لرننگ ماڈلز کو ضم کرنے پر غور کریں، تاریخی پیٹرن کی شناخت کی بنیاد پر تجارتی سگنلز کو فلٹر اور ترجیح دیں۔
- بہتری کی وجہ: مشین لرننگ پیچیدہ نمونوں کو دریافت کر سکتی ہے جن کی شناخت انسانوں کے لیے مشکل ہے، حکمت عملی کی ذہانت کی سطح کو بڑھاتی ہے۔
ان اصلاح کی سمتوں کو لاگو کرکے، حکمت عملی اپنی اصل خوبیوں کو برقرار رکھتے ہوئے موافقت، درستگی اور طویل مدتی منافع کو نمایاں طور پر بہتر بنا سکتی ہے، اور مارکیٹ کے مختلف حالات میں چیلنجوں کا بہتر طریقے سے مقابلہ کر سکتی ہے۔
خلاصہ
ملٹی ڈائمینشنل پیوٹ پوائنٹ ٹریڈنگ سسٹم ود ڈائنامک فبوناچی انڈیکیٹرز ایک جامع، منظم انٹرا ڈے ٹریڈنگ حکمت عملی کا نظام ہے۔ یہ روایتی تکنیکی تجزیہ کے اوزاروں (پیوٹ پوائنٹس، فبوناچی ریٹریسمنٹ، موونگ ایوریجز) کو جدید متحرک انڈیکیٹرز (VWAP، CPR) کے ساتھ ذہانت سے جوڑتا ہے۔ سخت کینڈل کی شرائط کی اسکریننگ اور متعدد انڈیکیٹرز کی تصدیق کے ذریعے، یہ تاجروں کو ایک امید افزا انٹرا ڈے ٹریڈنگ فریم ورک فراہم کرتا ہے۔
اس حکمت عملی کا بنیادی فائدہ قیمت کی کلیدی سطحوں کا جامع احاطہ اور ممکنہ ریورسل پوائنٹس کی حساس گرفتاری ہے۔ سخت کینڈل کی شناخت کی شرائط طے کرکے، حکمت عملی بے معنی مارکیٹ کے شور کی ایک بڑی مقدار کو فلٹر کر سکتی ہے اور زیادہ امکان والے تجارتی مواقع پر توجہ مرکوز کر سکتی ہے۔ ساتھ ہی، والیوم اور مومینٹم انڈیکیٹرز کا استعمال سگنل کی قابل اعتمادی کو مزید بڑھاتا ہے۔
تاہم، اس حکمت عملی میں کچھ حدود بھی ہیں، جیسے کہ ممکنہ طور پر زیادہ سگنلز، مخالف رجحان کی تجارت کے خطرات، اور پیرامیٹر کی اصلاح کے چیلنجز۔ ان مسائل کو حل کرنے کے لیے، ہم نے اصلاح کی کئی سمتیں تجویز کی ہیں، جن میں متحرک پیرامیٹر ایڈجسٹمنٹ، متعدد ٹائم فریم کی تصدیق، ذہین سرمائے کا انتظام، اور مارکیٹ کے ماحول کے مطابق ڈھلنا شامل ہیں۔ یہ اصلاحات تاجروں کو اپنی ضروریات اور مارکیٹ کی خصوصیات کے مطابق حکمت عملی کو ایڈجسٹ کرنے میں مدد دے سکتی ہیں، جس سے تجارت کی مجموعی تاثیر بہتر ہوتی ہے۔
یہ بات قابل ذکر ہے کہ کوئی بھی تجارتی حکمت عملی "جادوئی گولی" نہیں ہے۔ کامیاب تجارت کا انحصار نہ صرف خود حکمت عملی پر ہوتا ہے بلکہ تاجر کے صبر، نظم و ضبط، اور مسلسل سیکھنے پر بھی ہوتا ہے۔ اس حکمت عملی کے لیے، یہ سفارش کی جاتی ہے کہ تاجر پہلے اسے نقلی ماحول میں اچھی طرح آزمائیں، مختلف مارکیٹ حالات میں اس کی کارکردگی کی خصوصیات سے واقف ہوں، بتدریج پیرامیٹرز کو مخصوص تجارتی آلات اور ذاتی انداز کے مطابق ڈھالیں، اور آخر میں ایک ذاتی نوعیت کا، پائیدار منافع بخش تجارتی نظام تشکیل دیں۔
مسلسل مشق، رائے، اور اصلاح کے ذریعے، متعدد جہتی محوری نقطہ تجارتی نظام جو متحرک فبونیکی اشارے کے ساتھ ہے، ایک انٹرا ڈے تاجر کے اوزاروں کے ڈبے میں ایک طاقتور ہتھیار بن سکتا ہے، جو مختصر مدت کے مارکیٹ مواقع کو حاصل کرنے کے لیے ایک قابل اعتماد تکنیکی تجزیہ کا فریم ورک فراہم کرتا ہے۔
یہ حکمت عملی روایتی محوری نکات کو جدید تکنیکی اوزاروں کے ساتھ ملا کر ایک متوازن نقطہ نظر پیدا کرتی ہے جو مارکیٹ کے ڈھانچے کا احترام کرتی ہے جبکہ انٹرا ڈے قیمت کی نقل و حرکت کے لیے ذمہ دار رہتی ہے۔ اہم سطحوں پر قیمت کے اہم تعاملات پر توجہ مرکوز کرکے، تاجر مارکیٹ کی نفسیات کی گہری سمجھ پیدا کر سکتے ہیں اور ممکنہ طور پر اپنی تجارتی کارکردگی کو بہتر بنا سکتے ہیں۔
بالآخر، کامیاب نفاذ کے لیے سوچ سمجھ کر حسب ضرورت، سخت جانچ، اور نظم و ضبط سے عمل درآمد کی ضرورت ہوگی۔ جب اسے ایک جامع تجارتی منصوبے کے حصے کے طور پر مناسب طریقے سے لاگو کیا جاتا ہے جس میں مضبوط رسک مینجمنٹ کے اصول شامل ہوں، تو یہ حکمت عملی زیادہ اعتماد اور درستگی کے ساتھ انٹرا ڈے مارکیٹوں کی پیچیدگیوں کو نیویگیٹ کرنے کا ایک منظم طریقہ پیش کرتی ہے۔
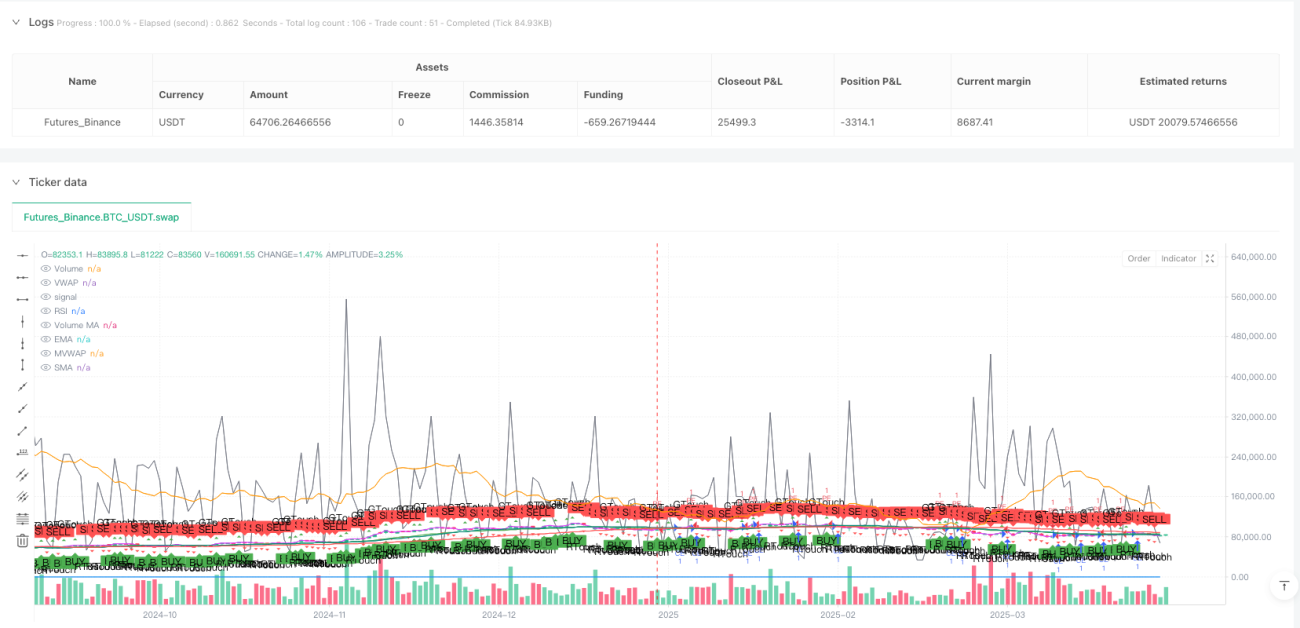
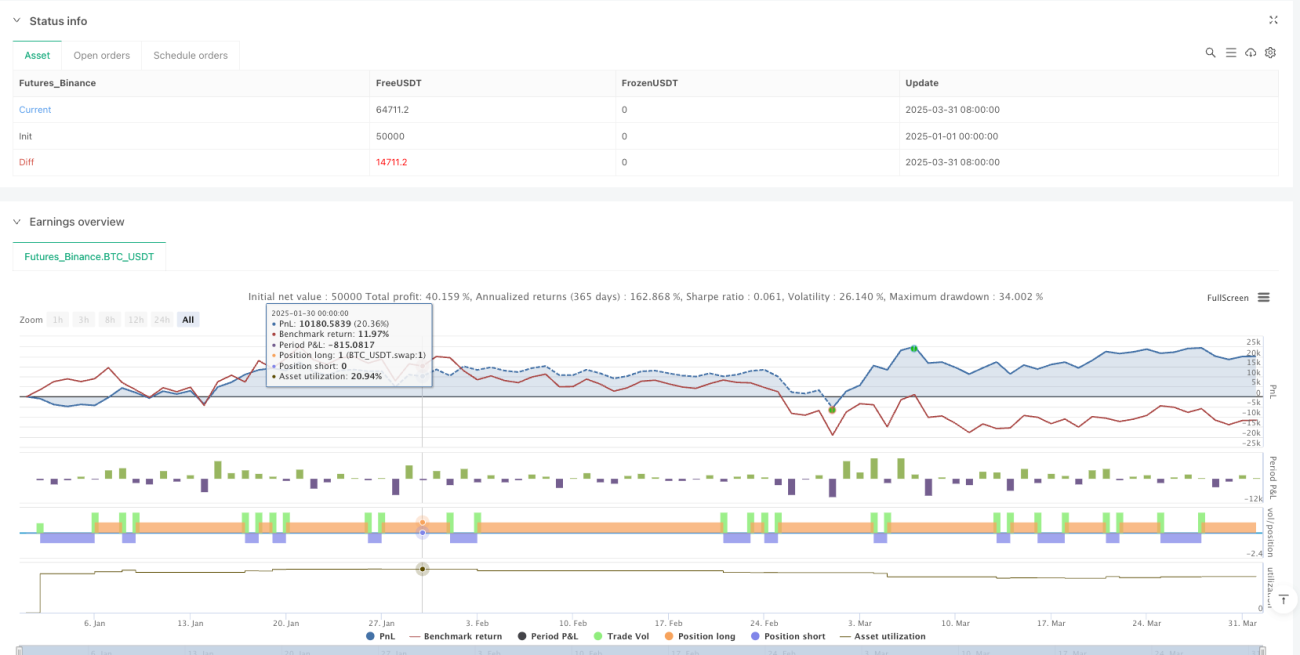
/*backtest
start: 2025-01-01 00:00:00
end: 2025-04-01 00:00:00
period: 1d
basePeriod: 1d
exchanges: [{"eid":"Futures_Binance","currency":"BTC_USDT"}]
*/

//@version=5
strategy("Pivot Point CE/PE Strategy", overlay=true)

// Identify 3-minute candles (Assuming the script is applied to a 3-minute chart)- 1