مقداری لانگ-شارٹ رجحان سے باخبر رہنے والی متحرک اسٹاپ لاس حکمت عملی

2
Follow
502
Followers
جائزہ
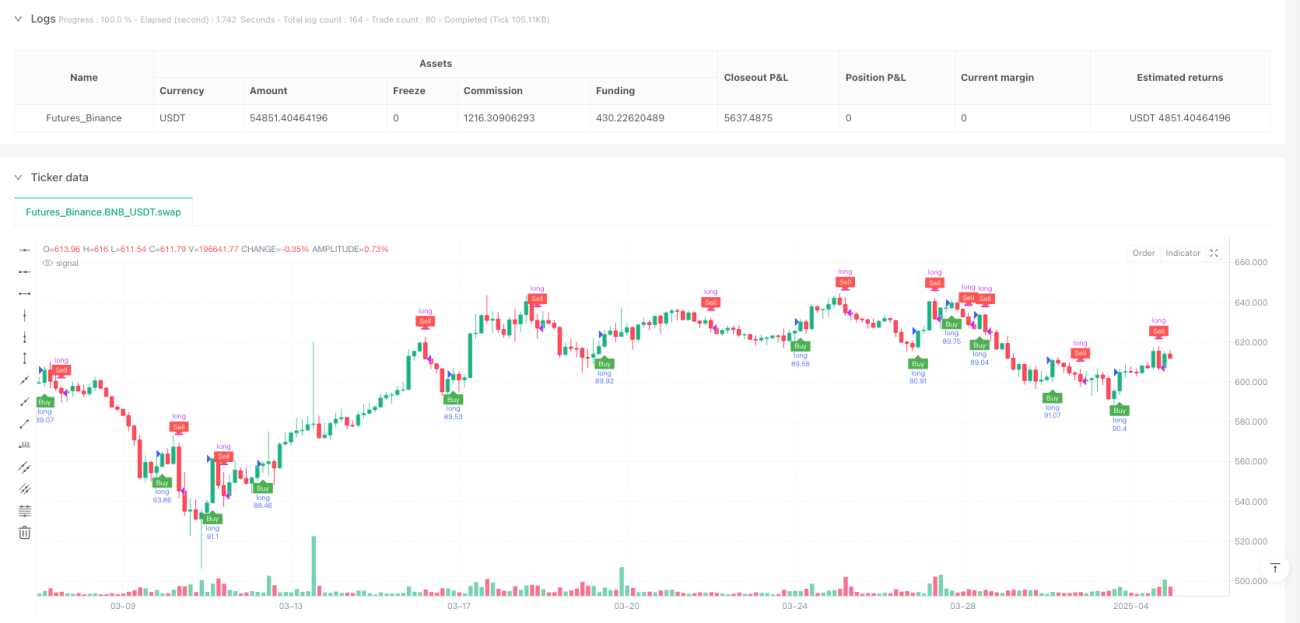
یہ اوسط حقیقی اتار چڑھاؤ (ATR) اور ایکسپونینشل موونگ اوریج (EMA) پر مبنی ایک لانگ/شارٹ ٹرینڈ فالو کرنے والی حکمت عملی ہے۔ یہ حکمت عملی متحرک اسٹاپ لاس اور رجحان کے فیصلے کے ذریعے مارکیٹ کے رجحان کی درست گرفت اور رسک مینجمنٹ فراہم کرتی ہے۔
حکمت عملی کا اصول
حکمت عملی کا بنیادی اصول درج ذیل اہم مراحل پر مشتمل ہے:
- ATR اشاریہ کا استعمال کرتے ہوئے متحرک اسٹاپ لاس پوائنٹ کا حساب لگانا
- قیمت کے رجحان کی سمت جاننے کے لیے EMA کا استعمال
- قیمت اور اسٹاپ لاس کے نسبتہ مقام کے ذریعے تجارتی سگنل کا تعین
- ہیکن ایشی (Heikin Ashi) کینڈل سٹک کا اختیاری استعمال سگنل کی شناخت کو بہتر بنانے کے لیے
اہم حسابی منطق:
- متحرک اسٹاپ لاس پوائنٹ = موجودہ قیمت ± (ATR * حساسیت کا گتانک)
- رجحان کا فیصلہ EMA اور اسٹاپ لاس پوائنٹ کے کراس اوور پر مبنی ہے
- جب قیمت اسٹاپ لاس پوائنٹ کو توڑتی ہے اور EMA کراس اوور ہوتا ہے تو تجارتی سگنل پیدا ہوتا ہے
حکمت عملی کے فوائد
- متحرک رسک مینجمنٹ: ATR خودکار طور پر اسٹاپ لاس پوائنٹ کا حساب لگاتا ہے، مارکیٹ کے اتار چڑھاؤ کے مطابق حقیقی وقت میں ایڈجسٹ ہوتا ہے
- رجحان کی درست پیروی: EMA قیمت کی تبدیلیوں پر تیزی سے رد عمل ظاہر کرتا ہے، رجحان کے موڑ کو پکڑتا ہے
- لچک: ATR کی مدت اور حساسیت کے گتانک کو حسب ضرورت تبدیل کیا جا سکتا ہے
- ہیکن ایشی کینڈل سٹک کا اختیاری استعمال سگنل کی شناخت کو مزید بہتر بناتا ہے
- کم تعدد تجارت، تجارتی اخراجات میں کمی
- متعدد مارکیٹوں اور متعدد مصنوعات کے لیے موزوں
حکمت عملی کے خطرات
- اتار چڑھاؤ والی مارکیٹ میں بار بار غلط سگنل پیدا ہو سکتے ہیں
- پیرامیٹرز کی غلط ترتیب سے زیادہ تجارت ہو سکتی ہے
- بنیادی عوامل اور غیر متوقع واقعات کے اثرات کو مدنظر نہیں رکھا گیا
- بیک ٹیسٹنگ اور لائیو ٹریڈنگ میں کچھ فرق ہو سکتا ہے
خطرات پر قابو پانے کی تجاویز:
- پیرامیٹرز کو بہتر بنائیں، حساسیت کے گتانک کو کم کریں
- دیگر اشاریوں کے ساتھ تصدیق کریں
- اسٹاپ لاس اور پوزیشن کا انتظام مقرر کریں
- مسلسل نگرانی اور متحرک ایڈجسٹمنٹ
حکمت عملی کی بہتری کے رخ
- مشین لرننگ الگورتھم متعارف کروا کر پیرامیٹرز کو متحرک طور پر بہتر بنانا
- متعدد وقت کے ادوار کی تصدیق شامل کرنا
- دیگر تکنیکی اشاریوں کے ساتھ مجموعہ
- خودکار پیرامیٹر انتخاب کا طریقہ کار تیار کرنا
- رسک ایڈجسٹمنٹ ماڈیول شامل کرنا
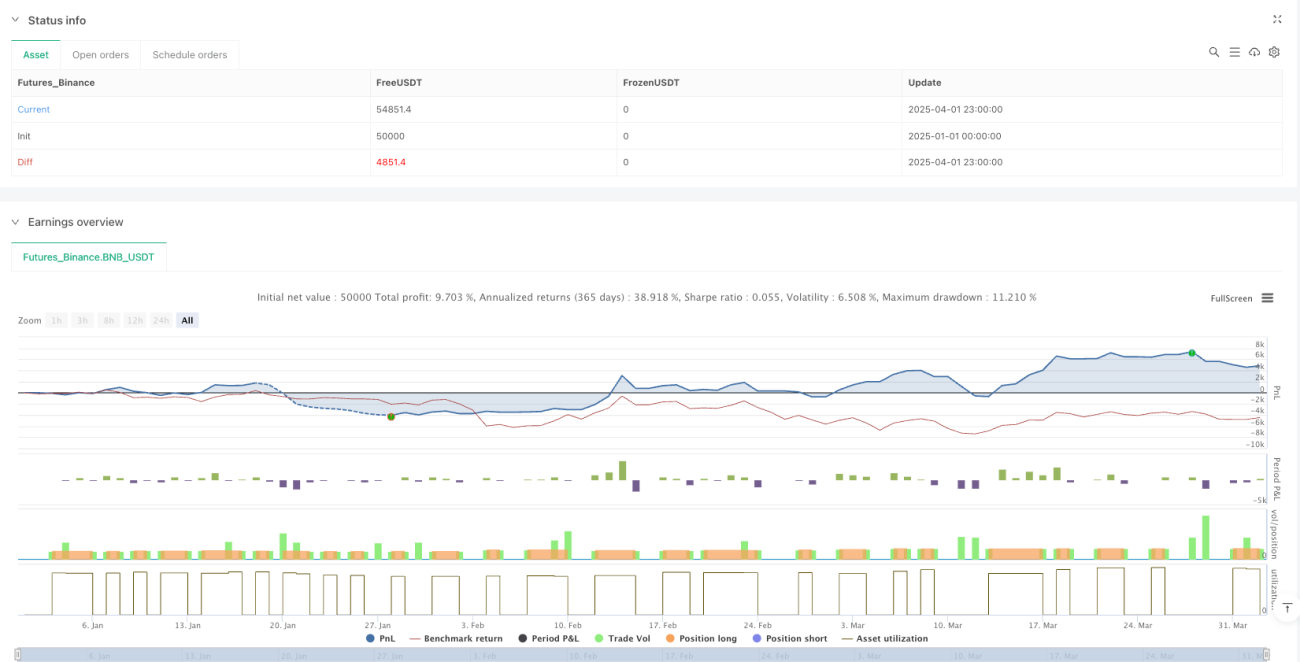
بہتری کے اہداف: حکمت عملی کے استحکام میں اضافہ، ڈرا ڈاؤن میں کمی، منافع کی کارکردگی میں بہتری
خلاصہ
یہ ATR اور EMA پر مبنی ایک متحرک رجحان کی پیروی کرنے والی حکمت عملی ہے، جو لچکدار اسٹاپ لاس میکانزم اور رجحان کے فیصلے کے ذریعے نسبتاً مستحکم مارکیٹ میں شرکت فراہم کرتی ہے۔ اس حکمت عملی میں اچھی موافقت اور رسک مینجمنٹ کی خصوصیات ہیں، لیکن اسے مسلسل بہتری اور تصدیق کی ضرورت ہے۔
Source
Pine
/*backtest
start: 2025-01-01 00:00:00
end: 2025-04-02 00:00:00
period: 3h
basePeriod: 3h
exchanges: [{"eid":"Futures_Binance","currency":"BNB_USDT"}]
*/

//@version=6
strategy("ducanhmaster v1", overlay=true, commission_type=strategy.commission.percent, commission_value=0.1, slippage=3, default_qty_type=strategy.percent_of_equity, default_qty_value=100)

// InputsStrategy parameters
Related strategies
Comment
All comments (0)
No data
- 1