کثیر سطحی فبونیکی رجحان کی پیروی اور ہیجنگ تجارتی حکمت عملی کا نظام

جائزہ
کثیر سطحی فبوناچی ٹرینڈ ٹریکنگ اور ہیجنگ ٹریڈنگ حکمت عملی کا نظام ایک جامع مقداری تجارتی حکمت عملی ہے جو متعدد تکنیکی تجزیہ کے اشاروں کو یکجا کرتا ہے۔ یہ حکمت عملی فبوناچی ریٹریسمنٹ تھیوری کو بنیاد بنا کر، ایکسپونینشل موونگ ایوریج (EMA)، اوریج ٹرو رینج (ATR)، اوریج ڈائریکشنل انڈیکس (ADX) اور ڈائریکشنل موومنٹ انڈیکیٹر (DMI) جیسے متعدد تکنیکی اشاروں کو شامل کر کے ایک کثیر جہتی مارکیٹ تجزیہ کا فریم ورک تشکیل دیتی ہے۔ یہ حکمت عملی نہ صرف روایتی ٹرینڈ ٹریکنگ کی صلاحیت رکھتی ہے، بلکہ اس میں ریباؤنڈ ٹریڈنگ میکانزم اور ہیجنگ فیچر بھی شامل ہیں، جس کا مقصد مختلف مارکیٹ حالات میں منافع کے مواقع حاصل کرنا اور مؤثر طریقے سے خطرے کو کنٹرول کرنا ہے۔
اس حکمت عملی کی انفرادیت اس کے کثیر سطحی رسک مینجمنٹ سسٹم اور لچکدار تجارتی موڈ میں ہے۔ متعدد منافع کے اہداف (TP1 اور TP2) اور ATR پر مبنی متحرک سٹاپ لاس طریقہ کار کے ذریعے، یہ حکمت عملی سرمائے کے تحفظ کے ساتھ ساتھ منافع کی صلاحیت کو زیادہ سے زیادہ کرنے کی صلاحیت رکھتی ہے۔ اس کے علاوہ، بلٹ ان ہیجنگ فنکشن حکمت عملی کو اضافی خطرے کی بفر فراہم کرتا ہے، جس سے یہ زیادہ اتار چڑھاؤ والے بازاروں میں بھی نسبتاً مستحکم کارکردگی دکھا سکتی ہے۔
حکمت عملی کا اصول
حکمت عملی کا بنیادی منطق فبوناچی ریٹریسمنٹ تھیوری اور ٹرینڈ تجزیہ کے امتزاج پر مبنی ہے۔ سب سے پہلے، حکمت عملی مخصوص مدت کے اندر سب سے اونچے اور سب سے نیچے پوائنٹس کا حساب لگا کر فبوناچی ریٹریسمنٹ لیولز کا تعین کرتی ہے، جن میں 23.6%، 38.2%، 50%، 61.8%، 78.6%، 100% اور 161.8% جیسی اہم پوزیشنیں شامل ہیں۔ ان لیولز کو اہم سپورٹ اور ریزسٹنس کے طور پر استعمال کیا جاتا ہے، جو تجارتی سگنلز کی تخلیق کے لیے کلیدی حوالہ فراہم کرتے ہیں۔
ٹرینڈ کی شناخت کے حوالے سے، حکمت عملی 50 پیریڈ کی ایکسپونینشل موونگ ایوریج کو ٹرینڈ کے تعین کا اہم ذریعہ استعمال کرتی ہے۔ جب قیمت لگاتار تین کینڈلز کے لیے EMA سے اوپر ہوتی ہے، تو اسے اوپر کی طرف رجحان سمجھا جاتا ہے؛ اس کے برعکس نیچے کی طرف رجحان ہوتا ہے۔ اس کے ساتھ ساتھ، حکمت عملی قیمت کے ڈھانچے کا بھی تجزیہ کرتی ہے، اونچے نچلے پوائنٹس اور اونچے اونچے پوائنٹس کی شناخت کے ذریعے بیلش ڈھانچے کی تصدیق کرتی ہے، اور نچلے اونچے پوائنٹس اور نچلے نچلے پوائنٹس کے ذریعے بیرش ڈھانچے کی تصدیق کرتی ہے۔
ADX اور DMI اشاروں کا اضافہ ٹرینڈ کی طاقت کے تعین کی درستگی کو بڑھاتا ہے۔ ADX کی قدر 20 سے زیادہ ہونے کو مضبوط رجحان کا معیار سمجھا جاتا ہے، جبکہ +DI اور -DI کی نسبتاً طاقت رجحان کی سمت کے تعین کے لیے استعمال ہوتی ہے۔ حجم کا تجزیہ بھی حکمت عملی کا ایک اہم حصہ ہے، جب حجم 20 پیریڈ کی اوسط سے 1.2 گنا زیادہ ہوتا ہے، تو اسے مؤثر حجم کی تصدیق سمجھا جاتا ہے۔
تجارتی سگنلز کی تخلیق کے لیے متعدد شرائط کا بیک وقت پورا ہونا ضروری ہے: رجحان کی سمت واضح ہو، قیمت اہم فبوناچی لیول کے قریب ہو، رجحان کی طاقت کافی ہو، سمتاتی اشارے تصدیق کریں اور حجم میں اضافہ ہو۔ فلٹرنگ کا یہ کثیر سطحی طریقہ کار سگنلز کی وشوسنییتا کو بہت بڑھاتا ہے اور غلط سگنلز کے امکان کو کم کرتا ہے۔
حکمت عملی کے فوائد
اس حکمت عملی کے متعدد نمایاں فوائد ہیں، سب سے پہلے اس کا جامع تکنیکی تجزیہ کا فریم ورک۔ فبوناچی تھیوری، ٹرینڈ تجزیہ، مومینٹم اشارے اور حجم کے تجزیے کو یکجا کر کے، حکمت عملی مارکیٹ کی حالت کو متعدد جہتوں سے جانچنے اور زیادہ جامع اور درست تجارتی سگنلز فراہم کرنے کی صلاحیت رکھتی ہے۔ متعدد اشاروں کے اس امتزاج کا طریقہ کار ایک اشارے کے ممکنہ گمراہ کن سگنلز کو مؤثر طریقے سے کم کرتا ہے، اور مجموعی حکمت عملی کے استحکام اور وشوسنییتا کو بہتر بناتا ہے۔
حکمت عملی کا رسک مینجمنٹ سسٹم اس کا ایک اور بڑا فائدہ ہے۔ دوہرا منافع کا ہدف میکانزم تاجروں کو پہلے ہدف تک پہنچنے پر کچھ منافع بند کرنے کی اجازت دیتا ہے، جبکہ باقی پوزیشن بڑے منافع کے حصول کے لیے برقرار رکھتا ہے۔ ATR پر مبنی متحرک سٹاپ لاس مارکیٹ کے اتار چڑھاؤ کے مطابق خود بخود خطرے کی سطح کو ایڈجسٹ کرتا ہے، جو کم اتار چڑھاؤ پر منافع کے تحفظ کے لیے سٹاپ کو سخت کرتا ہے اور زیادہ اتار چڑھاؤ پر معمولی اتار چڑھاؤ کی وجہ سے پوزیشن سے باہر ہونے سے بچنے کے لیے سٹاپ کو نرم کرتا ہے۔
ریباؤنڈ ٹریڈنگ کی خصوصیت حکمت عملی میں منافع کے اضافی مواقع شامل کرتی ہے۔ جب قیمت کسی اہم سپورٹ یا ریزسٹنس لیول سے واپس اچھلتی ہے، تو حکمت عملی اس قلیل مدتی ریورسل کا تیزی سے پتہ لگا کر اس میں حصہ لے سکتی ہے، اس طرح ٹرینڈ ٹریڈنگ کی بنیاد پر اضافی تجارتی مواقع پیدا ہوتے ہیں۔ یہ لچک حکمت عملی کو مختلف مارکیٹ حالات کے مطابق ڈھالنے کے قابل بناتی ہے، چاہے مضبوط رجحانی بازار ہوں یا رینج میں گھومتا ہوا بازار، مناسب تجارتی مواقع مل سکتے ہیں۔
ہیجنگ فنکشن کا انضمام اس حکمت عملی کی ایک جدید خصوصیت ہے۔ جب لانگ پوزیشن ہو اور شارٹ سگنل آئے، تو حکمت عملی ہیجنگ کے لیے شارٹ پوزیشن کھولتی ہے؛ اور اس کے برعکس۔ یہ میکانزم مارکیٹ کے تیزی سے الٹ جانے کی صورت میں اضافی تحفظ فراہم کرتا ہے، ممکنہ نقصان کو کم کرتا ہے اور اسے منافع کے نئے مواقع میں بدل سکتا ہے۔
ٹائم فلٹر کا استعمال زیادہ تجارت کے مسئلے کو روکتا ہے۔ لگاتار سگنلز کے درمیان کم از کم 5 کینڈلز کا وقفہ رکھنے کی شرط کے ذریعے، حکمت عملی کم وقت میں بار بار پوزیشن کھولنے سے گریز کرتی ہے، جس سے تجارتی اخراجات کم ہوتے ہیں اور سگنلز کے معیار میں بہتری آتی ہے۔
حکمت عملی کے خطرات
اگرچہ اس حکمت عملی کے متعدد فوائد ہیں، پھر بھی کچھ خطرات ہیں جن پر توجہ دینے کی ضرورت ہے۔ سب سے پہلے پیرامیٹر پر انحصار کا خطرہ ہے۔ اس حکمت عملی میں متعدد پیرامیٹرز شامل ہیں، جیسے فبوناچی دورانیہ، رواداری، ATR ضریب وغیرہ۔ ان پیرامیٹرز کا انتخاب حکمت عملی کی کارکردگی پر اہم اثر ڈالتا ہے۔ نامناسب پیرامیٹر سیٹنگ تاریخی ڈیٹا کے ساتھ حد سے زیادہ مماثلت یا حقیقی مارکیٹ میں ناقص کارکردگی کا سبب بن سکتی ہے۔ اس لیے، مخصوص مارکیٹ اور ٹائم فریم کے لیے موزوں ترین پیرامیٹر کمبینیشن تلاش کرنے کے لیے کافی بیک ٹیسٹنگ اور پیرامیٹر آپٹیمائزیشن کی ضرورت ہے۔
مارکیٹ کے ماحول کے ساتھ موافقت ایک اور ممکنہ خطرہ ہے۔ حکمت عملی بنیادی طور پر تکنیکی تجزیے پر مبنی ہے، لہٰذا بعض مارکیٹ حالات میں یہ ناقص کارکردگی دکھا سکتی ہے، مثلاً بنیادی عوامل سے چلنے والی مضبوط یک طرفہ حرکت میں تکنیکی اشارے ناکام ہو سکتے ہیں۔ اس کے علاوہ، انتہائی کم یا انتہائی زیادہ اتار چڑھاؤ والے بازاروں میں، حکمت عملی کے سگنلز کی تخلیق کی تعدد اور درستگی متاثر ہو سکتی ہے۔
سلپیج اور عمل درآمد کا خطرہ بھی قابل غور ہے۔ حقیقی تجارت میں، خاص طور پر زیادہ اتار چڑھاؤ والے حالات میں، آرڈر کے عمل درآمد کی قیمت اور متوقع قیمت کے درمیان فرق ہو سکتا ہے۔ سلپیج کا یہ لاگت حکمت عملی کے نظریاتی منافع کو کم کر سکتا ہے، خاص طور پر بار بار تجارت کرنے والی حکمت عملیوں کے لیے۔
ہیجنگ فنکشن اگرچہ اضافی تحفظ فراہم کرتا ہے، لیکن اس سے حکمت عملی کی پیچیدگی بھی بڑھ جاتی ہے۔ بعض صورتوں میں، ہیجنگ کی کارروائیوں کی وجہ سے لانگ اور شارٹ دونوں پوزیشنیں نقصان میں جا سکتی ہیں، یا فیسوں کے لحاظ سے اضافی اخراجات ہو سکتے ہیں۔ اس لیے، ہیجنگ فنکشن کے حقیقی اثرات کا بغور جائزہ لینے کی ضرورت ہے اور یہ سوچنا ہوگا کہ آیا مخصوص مارکیٹ حالات میں اسے فعال کیا جائے۔
حکمت عملی کی بہتری کے رخ
حکمت عملی کی کارکردگی کو مزید بہتر بنانے کے لیے، کئی سمتوں میں اصلاح کی جا سکتی ہے۔ سب سے پہلے متحرک پیرامیٹر ایڈجسٹمنٹ میکانزم کا تعارف ہے۔ مارکیٹ کے اتار چڑھاؤ، رجحان کی طاقت وغیرہ کے مطابق فبوناچی دورانیہ، ATR ضریب جیسے اہم پیرامیٹرز کو متحرک طور پر ایڈجسٹ کیا جا سکتا ہے۔ مثال کے طور پر، زیادہ اتار چڑھاؤ والے بازار میں ATR ضریب بڑھا کر سٹاپ لاس کی جگہ بڑی دی جائے، اور کم اتار چڑھاؤ والے بازار میں ATR ضریب کم کر کے خطرے کو سخت کیا جائے۔
مشین لرننگ ٹیکنالوجی کا انضمام ایک اور اہم بہتری کا رخ ہے۔ مشین لرننگ الگورتھم کا استعمال داخلے کے بہترین مواقع کی شناخت کے لیے کیا جا سکتا ہے، یا تاریخی ڈیٹا سے پیرامیٹرز کے بہترین سیٹ اپ کو سیکھنے کے لیے۔ اس کے علاوہ، مارکیٹ کے جذبات اور خبروں کے واقعات کے قیمت پر اثر کا تجزیہ کرنے کے لیے نیچرل لینگویج پروسیسنگ کا استعمال کیا جا سکتا ہے، جس سے حکمت عملی میں بنیادی تجزیہ کا ایک اور جہت شامل ہو جائے گی۔
کثیر ٹائم فریم تجزیہ کا انضمام مارکیٹ کا زیادہ جامع نظریہ فراہم کر سکتا ہے۔ طویل ٹائم فریم پر بڑے رجحان کی تصدیق کی جا سکتی ہے، جبکہ چھوٹے ٹائم فریم پر داخلے کے درست پوائنٹس تلاش کیے جا سکتے ہیں۔ ٹائم فریموں کا یہ مربوط تجزیہ سگنلز کے معیار کو بہتر بنا سکتا ہے اور مخالف رجحان میں تجارت کے خطرے کو کم کر سکتا ہے۔
رسک مینجمنٹ کی بہتری بھی حکمت عملی کی کارکردگی کو بہتر بنانے کا ایک اہم راستہ ہے۔ مارکیٹ کے حالات، حکمت عملی کے اعتماد کی سطح وغیرہ کے مطابق پوزیشن کے سائز کو متحرک طور پر ایڈجسٹ کیا جا سکتا ہے۔ مثال کے طور پر، زیادہ اعتماد والے سگنل پر پوزیشن بڑھائی جائے، اور کم اعتماد والے سگنل پر پوزیشن کم کی جائے۔ اس کے علاوہ، زیادہ سے زیادہ نقصان کو کنٹرول کرنے کا میکانزم بھی متعارف کرایا جا سکتا ہے، جب حکمت عملی بڑے نقصان کا شکار ہو تو خود بخود پوزیشن کو کم کیا جائے یا تجارت روک دی جائے۔
سٹاپ لاس اور منافع کے ہدف کی منطق کو مزید بہتر بنانا بھی قابل غور ہے۔ قیمت کی حرکت کے مطابق سٹاپ لاس کو متحرک طور پر ایڈجسٹ کرنے کے لیے ٹریلنگ سٹاپ کا استعمال کیا جا سکتا ہے تاکہ زیادہ منافع محفوظ کیا جا سکے۔ اسی طرح، مارکیٹ کے ڈھانچے کی بنیاد پر زیادہ ذہین منافع کے اہداف مقرر کیے جا سکتے ہیں، مثلاً اہم ریزسٹنس لیول کے قریب پہلے ہی منافع بک کیا جائے۔
خلاصہ
کثیر سطحی فبوناچی ٹرینڈ ٹریکنگ اور ہیجنگ ٹریڈنگ حکمت عملی کا نظام جدید مقداری تجارتی ٹیکنالوجی کی ایک اہم ترقی کی سمت کی نمائندگی کرتا ہے۔ یہ حکمت عملی متعدد کلاسیکی تکنیکی تجزیہ کے اوزاروں کو ہوشیاری سے یکجا کر کے ایک مضبوط اور لچکدار تجارتی فریم ورک تشکیل دیتی ہے۔ اس کے کثیر سطحی فلٹرنگ میکانزم سگنلز کے معیار کو یقینی بناتے ہیں، کثیر سطحی رسک مینجمنٹ سسٹم مؤثر سرمائے کا تحفظ فراہم کرتا ہے، اور ہیجنگ فنکشن حکمت عملی میں اضافی حفاظتی مارجن کا اضافہ کرتا ہے۔
حکمت عملی کے کامیاب نفاذ کے لیے اس کے بنیادی اصولوں اور عمل کے طریقہ کار کی مکمل سمجھ، اور مخصوص تجارتی ماحول کے مطابق مناسب پیرامیٹر ایڈجسٹمنٹ اور اصلاح کی ضرورت ہے۔ اگرچہ یہ حکمت عملی نظریاتی طور پر اچھی طرح ڈیزائن کی گئی ہے، لیکن عملی اطلاق میں مارکیٹ کے مائیکرو اسٹرکچر، تجارتی اخراجات، سلپیج جیسے حقیقی عوامل کے اثرات پر غور کرنا ضروری ہے۔
مصنوعی ذہانت اور مشین لرننگ ٹیکنالوجی کی مسلسل ترقی کے ساتھ، اس حکمت عملی میں بہتری کی بہت گنجائش ہے۔ زیادہ جدید ڈیٹا تجزیہ کی تکنیکوں اور خود موافقت کے میکانزم کو شامل کر کے، حکمت عملی کی کارکردگی میں مزید اضافہ کیا جا سکتا ہے۔ مقداری تاجروں کے لیے، اس قسم کی جامع حکمت عملی ایک قیمتی سیکھنے اور بہتری کا پلیٹ فارم فراہم کرتی ہے، جو مارکیٹ کی حرکیات اور رسک مینجمنٹ کی اہمیت کو گہرائی سے سمجھنے میں مدد دیتی ہے۔
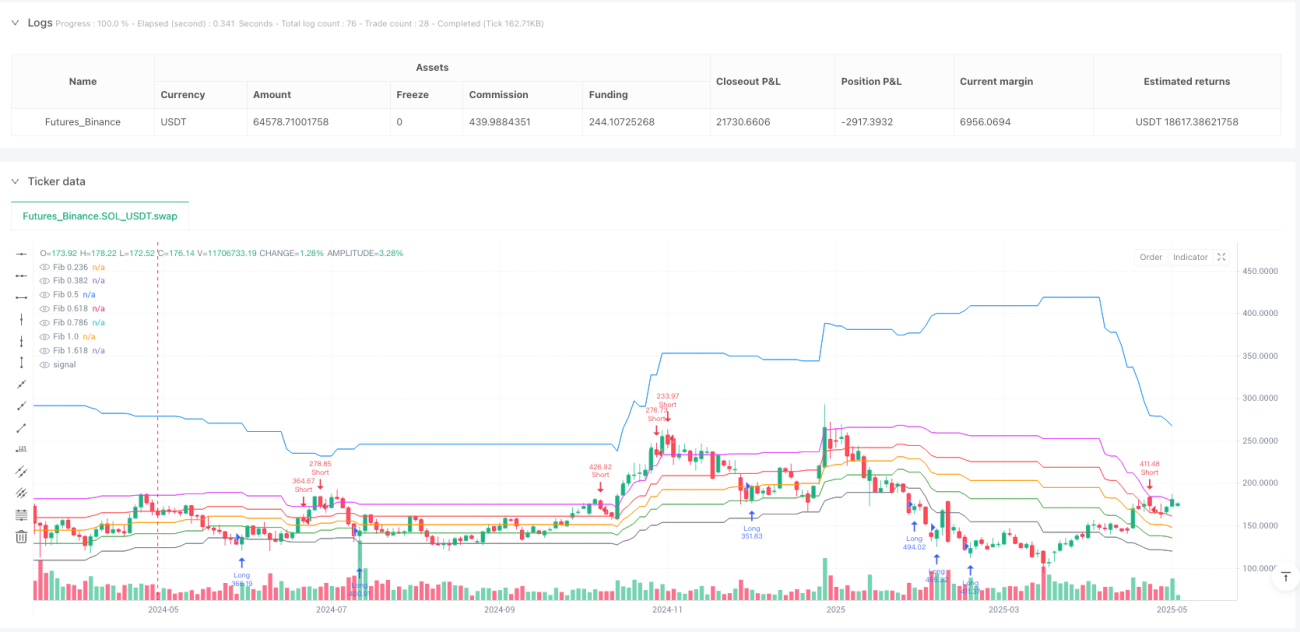
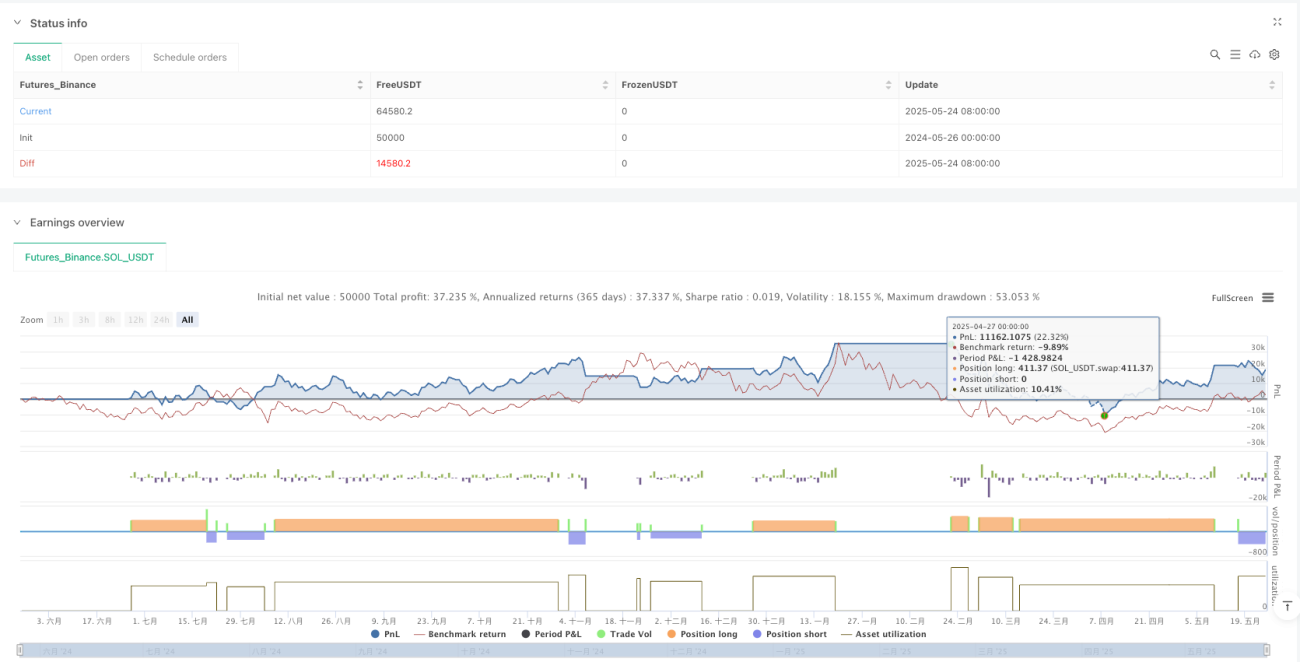
/*backtest
start: 2024-05-26 00:00:00
end: 2025-05-25 00:00:00
period: 2d
basePeriod: 2d
exchanges: [{"eid":"Futures_Binance","currency":"SOL_USDT"}]
*/

//@version=5
strategy("Fibonacci Trend v6.4 - TP/SL Labels", overlay=true, default_qty_type=strategy.percent_of_equity, default_qty_value=100)

// === Parameters ===- 1