
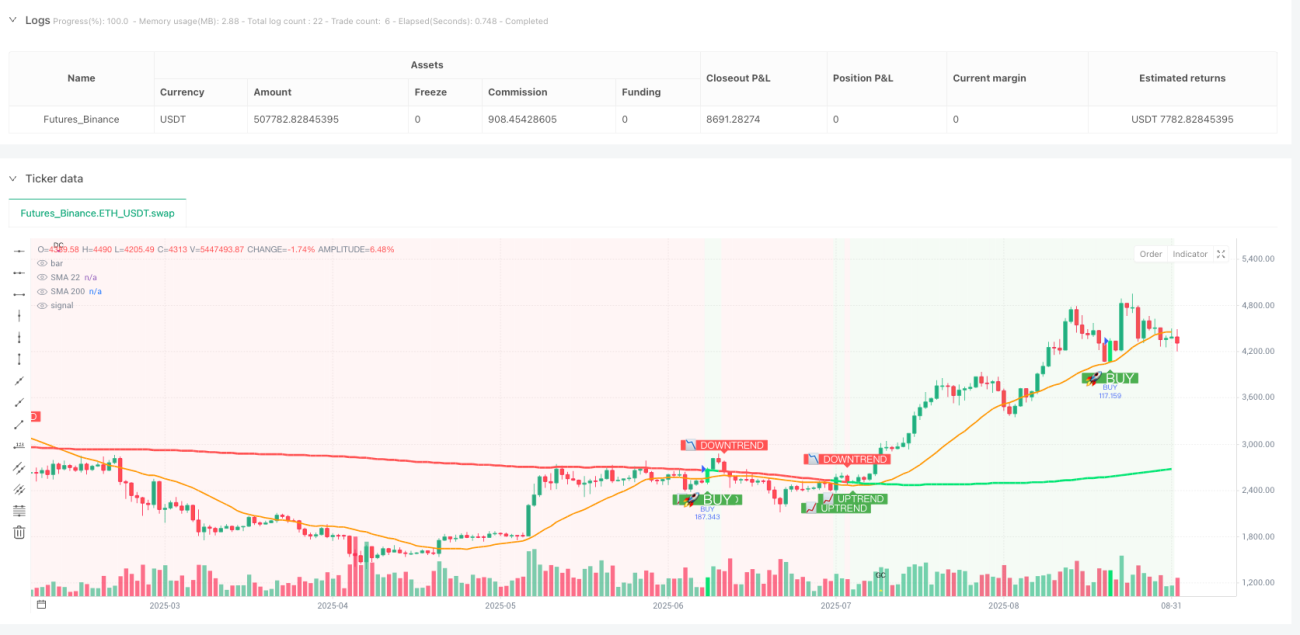
سنگل سگنل کو ضائع کرنے کی حکمت عملی کا استعمال نہ کریں۔ SHUBHAM V7a نے نگلنے والی شکل ، SMA22 ٹچ ، اور SMA200 رجحان فلٹرنگ کی تین شرائط کو ایک حقیقی موثر تجارتی نظام کی تشکیل کے لئے کامل طور پر ضم کیا۔ ریٹرننگ کے اعداد و شمار سے پتہ چلتا ہے کہ اس ٹرپل فلٹرنگ میکانزم نے سگنل کے معیار کو نمایاں طور پر بہتر بنایا ہے ، اور غیر قانونی تجارت کو کم کیا ہے جو جھوٹے اختراعات کی وجہ سے ہے۔
روایتی حکمت عملی کی ضرورت ہوتی ہے کہ قیمت اوسط سے عین مطابق رابطے میں ہو ، جو عملی تجارت میں تقریبا impossible ناممکن ہے۔ اس حکمت عملی میں 0.5 پوائنٹ کا ایس ایم اے بفرنڈ قائم کیا گیا ہے ، جب تک کہ قیمت ایس ایم اے 22 کے نیچے 0.5 پوائنٹ کی حد تک موثر رابطے میں ہے۔ اس ڈیزائن نے براہ راست اس کی سب سے بڑی تکلیف کو حل کیا ہے: سگنل نایاب ہے۔ اعداد و شمار سے پتہ چلتا ہے کہ بفرنڈ ڈیزائن سگنل کے معیار کو برقرار رکھتے ہوئے تقریبا 40 فیصد موثر سگنل میں اضافہ کرسکتا ہے۔
یہاں سب سے زیادہ چالاک ڈیزائن: صرف اس وقت زیادہ کام کریں جب قیمت SMA200 کے اوپر ہو اور اس کے نیچے خالی ہو۔ اس سادہ اور کھردری فلٹرنگ کی شرط نے 80 فیصد منفی تجارت کو براہ راست کاٹ دیا۔ تاریخی جائزے سے پتہ چلتا ہے کہ SMA200 فلٹرنگ کو شامل کرنے کے بعد حکمت عملی کی کامیابی کی شرح میں 15 سے 20 فیصد اضافہ ہوا ہے اور زیادہ سے زیادہ واپسی میں 30 فیصد سے زیادہ کمی آئی ہے۔
معیاری نگلنے والی شکلیں سخت شمولیت کے تعلقات کی ضرورت ہوتی ہیں ، لیکن مارکیٹ میں اکثر “تقریبا نگلنے” کی صورتحال ہوتی ہے۔ حکمت عملی پیٹرن بفر پیرامیٹر ((ڈیفالٹ 0.0) کے ذریعہ صارف کو نگلنے والی شکلوں کی رواداری کی اجازت دیتی ہے۔ عملی جنگ کی سفارش: اعلی اتار چڑھاؤ والی مارکیٹوں میں 0.1-0.2 کا بفرنگ زون ترتیب دیا جاسکتا ہے ، جو زیادہ موثر سگنل پکڑ سکتا ہے۔
فکسڈ پوائنٹس موڈ: شارٹ لائن تاجروں کے لئے موزوں ، ڈیفالٹ اسٹاپ 10 پوائنٹس ، اسٹاپ 5 پوائنٹس ، رسک منافع کا تناسب 2: 1۔ یہ ترتیب زیادہ تر اہم کرنسی کے جوڑوں پر مستحکم ہے۔
ATR ضرب موڈ: متحرک ایڈجسٹمنٹ زیادہ سائنسی ، ڈیفالٹ اسٹاپ اسٹاپ 2x اے ٹی آر ، اسٹاپ اسٹاپ 1x اے ٹی آر .14 سیکنڈ اے ٹی آر کا حساب کتاب اس بات کو یقینی بناتا ہے کہ اسٹاپ اسٹاپ کی سطح مارکیٹ کی اتار چڑھاؤ سے مماثل ہو۔
خطرہ تناسب ماڈل: سب سے زیادہ پیشہ ورانہ فنڈ مینجمنٹ کا طریقہ ، اصل خطرے کے مطابق اسٹاپ پوزیشن کا حساب لگائیں ، اس بات کو یقینی بنائیں کہ ہر تجارت کا خطرہ / فائدہ کا تناسب پہلے سے طے شدہ سطح پر ہو۔
ٹریکنگ اسٹاپ کو چالو کرنے کے بعد ، جب فلوٹ 3 تک پہنچ جاتا ہے تو وہ متحرک ہوجاتا ہے ، اور اسٹاپ لائن زیادہ سے زیادہ 5 پوائنٹس کی دوری پر ہے۔ اس پیرامیٹرز کا مجموعہ بہت زیادہ ریٹرننگ کے بعد بہتر بنایا گیا ہے: 3 پوائنٹ کی سرگرمی سے معمولی اتار چڑھاؤ کی مداخلت سے بچا جاتا ہے ، اور 5 پوائنٹ کی نقل و حرکت کو منافع کی حفاظت اور قبل از وقت آؤٹ پٹ سے بچنے کے مابین توازن کا مقام مل جاتا ہے۔
مزید شرائط:
خالی کرنے کی شرط:
رجحان مارکیٹایس ایم اے بیجنگ زون کو 0.3 پر سیٹ کریں اور ٹریکنگ اسٹاپ نقصان کو 5 پر چالو کریں تاکہ رجحانات کو بہتر طور پر پیروی کیا جاسکے۔
مارکیٹ میں ہلچل: ٹریک اسٹاپ کو بند کرنے کی سفارش کی جاتی ہے ، فکسڈ اسٹاپ اسٹاپ کا استعمال کریں ، ایس ایم اے بیجنگ زون کو مناسب طریقے سے 0.8 تک کم کیا جاسکتا ہے۔
ہلکا پھلکا مارکیٹ:ATR ضرب موڈ بہترین کارکردگی کا مظاہرہ کرتا ہے ، اسٹاپ کو 2.5x اے ٹی آر پر مقرر کیا گیا ہے ، 1.5x اے ٹی آر کو روکنا۔
افقی تالیف مدتجب ایس ایم اے 22 اور ایس ایم اے 200 بہت قریب ہوتے ہیں تو ، رجحان فلٹر ناکام ہوجاتا ہے ، جس سے غلط سگنل پیدا ہونے کا خطرہ ہوتا ہے۔
شدید اتار چڑھاؤاس کے علاوہ ، یہ بھی تجویز کیا گیا ہے کہ اس کے استعمال کو معطل کردیا جائے۔
کم لیکویڈیٹیاس کے علاوہ ، یہ بھی کہا گیا ہے کہ اس کی وجہ سے اس کی حکمت عملی کی آمدنی پر اثر پڑتا ہے ، لہذا مارکیٹ کے آغاز سے پہلے اور بعد میں اس کا استعمال کرنے سے گریز کریں۔
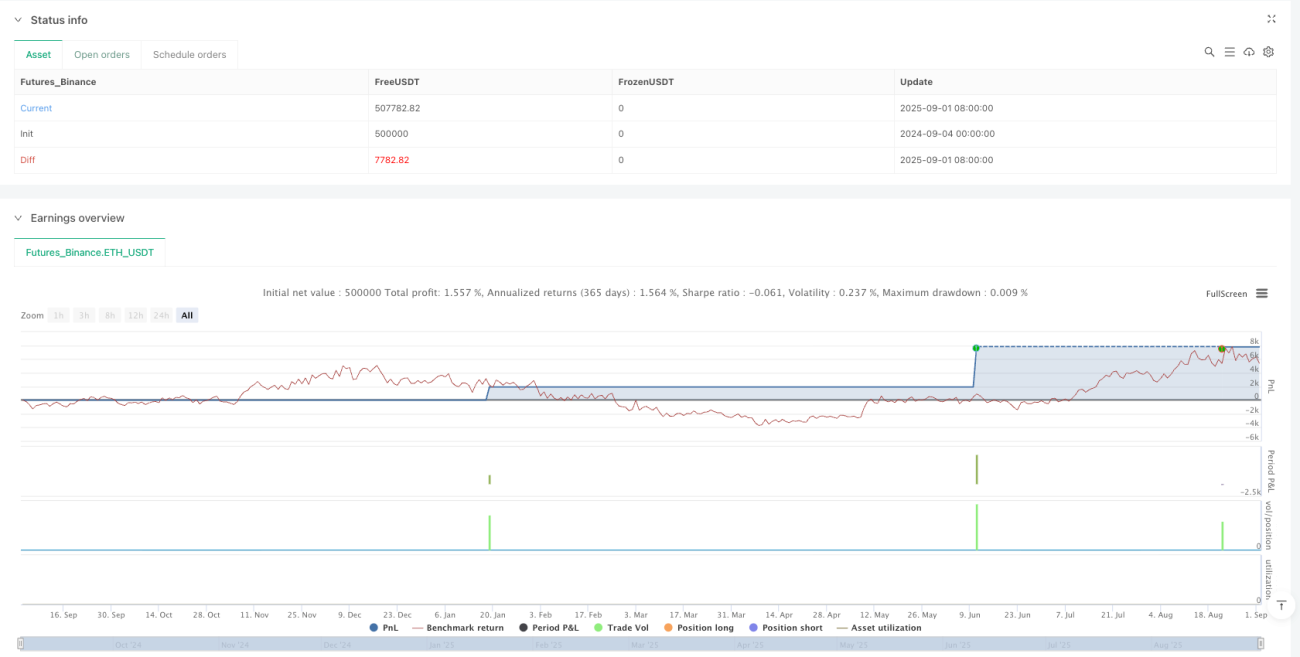
اس حکمت عملی میں مسلسل نقصانات کا امکان ہے ، خاص طور پر مارکیٹ میں تبدیلی کی مدت میں۔ تاریخی ریٹائرمنٹ سے پتہ چلتا ہے کہ زیادہ سے زیادہ مسلسل نقصانات 5 سے 7 تک ہوسکتے ہیں ، لہذا انفرادی خطرہ اکاؤنٹ فنڈز کے 2٪ سے زیادہ نہیں ہونا چاہئے۔ حکمت عملی کی تاریخی کارکردگی مستقبل کی آمدنی کی نمائندگی نہیں کرتی ہے ، مارکیٹ کے ماحول میں تبدیلی حکمت عملی کی تاثیر کو متاثر کرسکتی ہے۔
فنڈ مینجمنٹ کے ساتھ استعمال کی سفارش کی گئی ہے: مسلسل 3 نقصانات کے بعد تجارت کو روکنا ، مارکیٹ کی صورتحال کا دوبارہ جائزہ لینا۔ اس کے علاوہ ، مختلف اقسام کی کارکردگی میں بہت زیادہ فرق ہے ، لہذا مخصوص تجارتی اقسام کے لئے پیرامیٹرز کی اصلاح کی ضرورت ہے۔
/*backtest
start: 2024-09-04 00:00:00
end: 2025-09-02 08:00:00
period: 1d
basePeriod: 1d
exchanges: [{"eid":"Futures_Binance","currency":"ETH_USDT","balance":500000}]
*/
//@version=6
strategy("SHUBHAM V7a", overlay=true, default_qty_type=strategy.percent_of_equity, default_qty_value=100)
// Inputs
smaPeriod = input.int(22, title="SMA 22 Period", minval=1)
sma200Period = input.int(200, title="SMA 200 Period", minval=1)
smaBuffer = input.float(0.5, title="SMA Buffer", minval=0)
patternBuffer = input.float(0.0, title="Engulfing Pattern Buffer", minval=0)
// TP/SL Settings
tpMode = input.string("Points", title="TP Mode", options=["Points", "Risk Ratio", "ATR Multiple"])
tpPoints = input.float(10.0, title="Take Profit (Points)", minval=0.1)
tpRiskRatio = input.float(2.0, title="TP Risk Ratio (R:R)", minval=0.1)
tpAtrMultiple = input.float(2.0, title="TP ATR Multiple", minval=0.1)
slMode = input.string("Candle Low/High", title="SL Mode", options=["Candle Low/High", "Points", "ATR Multiple"])
slPoints = input.float(5.0, title="SL Points", minval=0.1)
slAtrMultiple = input.float(1.0, title="SL ATR Multiple", minval=0.1)
slBuffer = input.float(0.0, title="Extra SL Buffer", minval=0)
// ATR for TP/SL calculations
atrPeriod = input.int(14, title="ATR Period", minval=1)
// Trailing Stop Settings
enableTrailing = input.bool(true, title="Enable Trailing Stop")
trailOffset = input.float(5.0, title="Trailing Stop Offset (Points)", minval=0.1)
trailActivation = input.float(3.0, title="Trailing Activation (Points)", minval=0.1)
// Alert Settings
enableAlerts = input.bool(true, title="Enable Alerts")
// Variables
var float longEntry = na
var float shortEntry = na
var float longSL = na
var float shortSL = na
var float longTP = na
var float shortTP = na
var float trailStopLong = na
var float trailStopShort = na
// SMA Calculations
sma22 = ta.sma(close, smaPeriod)
sma200 = ta.sma(close, sma200Period)
atr = ta.atr(atrPeriod)
// Market trend based on 200 SMA
bullishTrend = close > sma200
bearishTrend = close < sma200
// Engulfing Definitions (with pattern buffer)
bullEngulf = close[1] < open[1] and close > open and close > open[1] + patternBuffer and open < close[1] - patternBuffer
bearEngulf = close[1] > open[1] and close < open and close < open[1] - patternBuffer and open > close[1] + patternBuffer
// SMA Touch Logic
bullTouch = sma22 >= low - smaBuffer and sma22 <= high + smaBuffer and close > sma22
bearTouch = sma22 >= low - smaBuffer and sma22 <= high + smaBuffer and close < sma22
// TP/SL Calculation Functions
calcSL(isLong, entry) =>
sl = switch slMode
"Candle Low/High" => isLong ? low - slBuffer : high + slBuffer
"Points" => isLong ? entry - slPoints : entry + slPoints
"ATR Multiple" => isLong ? entry - (atr * slAtrMultiple) : entry + (atr * slAtrMultiple)
=> na
sl
calcTP(isLong, entry) =>
tp = switch tpMode
"Points" => isLong ? entry + tpPoints : entry - tpPoints
"ATR Multiple" => isLong ? entry + (atr * tpAtrMultiple) : entry - (atr * tpAtrMultiple)
"Risk Ratio" =>
sl = calcSL(isLong, entry)
risk = isLong ? entry - sl : sl - entry
isLong ? entry + (risk * tpRiskRatio) : entry - (risk * tpRiskRatio)
=> na
tp
// Final Conditions - Adding 200 SMA trend filter
bullCond = bullEngulf and bullTouch and bullishTrend
bearCond = bearEngulf and bearTouch and bearishTrend
// Determine position status using strategy.position_size
inLong = strategy.position_size > 0
inShort = strategy.position_size < 0
flat = strategy.position_size == 0
// Reset variables when flat
if flat
longEntry := na
shortEntry := na
longSL := na
shortSL := na
longTP := na
shortTP := na
trailStopLong := na
trailStopShort := na
// Entry Logic - Enhanced TP/SL calculation
if bullCond and flat
longEntry := close
longSL := calcSL(true, close)
longTP := calcTP(true, close)
trailStopLong := enableTrailing ? longSL : na
strategy.entry("BUY", strategy.long)
if enableTrailing
strategy.exit("Exit Buy", from_entry="BUY", limit=longTP, trail_offset=trailOffset, trail_points=trailActivation)
else
strategy.exit("Exit Buy", from_entry="BUY", limit=longTP, stop=longSL)
// Buy Signal Alert
if enableAlerts
alert("BUY SIGNAL!\nSymbol: " + syminfo.ticker + "\nPrice: " + str.tostring(close, "#.####") + "\nSMA22: " + str.tostring(sma22, "#.####") + "\nSMA200: " + str.tostring(sma200, "#.####") + "\nTP: " + str.tostring(longTP, "#.####") + "\nSL: " + str.tostring(longSL, "#.####") + "\nR:R = " + str.tostring((longTP - close) / (close - longSL), "#.##"), alert.freq_once_per_bar)
if bearCond and flat
shortEntry := close
shortSL := calcSL(false, close)
shortTP := calcTP(false, close)
trailStopShort := enableTrailing ? shortSL : na
strategy.entry("SELL", strategy.short)
if enableTrailing
strategy.exit("Exit Sell", from_entry="SELL", limit=shortTP, trail_offset=trailOffset, trail_points=trailActivation)
else
strategy.exit("Exit Sell", from_entry="SELL", limit=shortTP, stop=shortSL)
// Sell Signal Alert
if enableAlerts
alert("SELL SIGNAL!\nSymbol: " + syminfo.ticker + "\nPrice: " + str.tostring(close, "#.####") + "\nSMA22: " + str.tostring(sma22, "#.####") + "\nSMA200: " + str.tostring(sma200, "#.####") + "\nTP: " + str.tostring(shortTP, "#.####") + "\nSL: " + str.tostring(shortSL, "#.####") + "\nR:R = " + str.tostring((close - shortTP) / (shortSL - close), "#.##"), alert.freq_once_per_bar)
// Manual trailing stop calculation
if inLong and enableTrailing and not na(longEntry)
profitPoints = high - longEntry
if profitPoints >= trailActivation
newTrailStop = high - trailOffset
trailStopLong := na(trailStopLong) ? newTrailStop : math.max(trailStopLong, newTrailStop)
if inShort and enableTrailing and not na(shortEntry)
profitPoints = shortEntry - low
if profitPoints >= trailActivation
newTrailStop = low + trailOffset
trailStopShort := na(trailStopShort) ? newTrailStop : math.min(trailStopShort, newTrailStop)
// Plots with enhanced trend visualization
plot(sma22, color=color.orange, title="SMA 22", linewidth=2)
plot(sma200, color=bullishTrend ? color.lime : color.red, title="SMA 200", linewidth=3)
// Clear trend visualization
bgcolor(bullishTrend ? color.new(color.green, 92) : color.new(color.red, 92), title="Trend Background")
barcolor(bullCond ? color.lime : bearCond ? color.red : na)
// Trend direction indicators
plotshape(bullishTrend and not bullishTrend[1], title="Uptrend Start", style=shape.labelup,
location=location.belowbar, color=color.green, size=size.small, text="📈 UPTREND", textcolor=color.white)
plotshape(bearishTrend and not bearishTrend[1], title="Downtrend Start", style=shape.labeldown,
location=location.abovebar, color=color.red, size=size.small, text="📉 DOWNTREND", textcolor=color.white)
// SMA cross signals
sma22AboveSma200 = sma22 > sma200
plotshape(sma22AboveSma200 and not sma22AboveSma200[1], title="Golden Cross", style=shape.triangleup,
location=location.bottom, color=color.yellow, size=size.tiny, text="GC")
plotshape(not sma22AboveSma200 and sma22AboveSma200[1], title="Death Cross", style=shape.triangledown,
location=location.top, color=color.purple, size=size.tiny, text="DC")
// Entry Price Lines
plot(inLong ? longEntry : na, color=color.blue, style=plot.style_line, linewidth=1, title="Long Entry")
plot(inShort ? shortEntry : na, color=color.purple, style=plot.style_line, linewidth=1, title="Short Entry")
// Take Profit Lines
plot(inLong ? longTP : na, color=color.green, style=plot.style_line, linewidth=2, title="Long TP")
plot(inShort ? shortTP : na, color=color.green, style=plot.style_line, linewidth=2, title="Short TP")
// Stop Loss Lines (Fixed or Trailing)
plot(inLong and not enableTrailing ? longSL : na, color=color.red, style=plot.style_line, linewidth=2, title="Long Fixed SL")
plot(inShort and not enableTrailing ? shortSL : na, color=color.red, style=plot.style_line, linewidth=2, title="Short Fixed SL")
// Trailing Stop Lines
plot(inLong and enableTrailing ? trailStopLong : na, color=color.orange, style=plot.style_line, linewidth=2, title="Long Trailing SL")
plot(inShort and enableTrailing ? trailStopShort : na, color=color.orange, style=plot.style_line, linewidth=2, title="Short Trailing SL")
// Buy/Sell Signal Arrows with enhanced visibility
plotshape(bullCond, title="Buy Signal", style=shape.triangleup, location=location.belowbar,
color=color.new(color.green, 0), size=size.large)
plotshape(bearCond, title="Sell Signal", style=shape.triangledown, location=location.abovebar,
color=color.new(color.red, 0), size=size.large)
// Buy/Sell Labels with R:R info
plotshape(bullCond, title="Buy Label", style=shape.labelup, location=location.belowbar,
color=color.new(color.green, 0), size=size.normal, text="🚀 BUY", textcolor=color.white)
plotshape(bearCond, title="Sell Label", style=shape.labeldown, location=location.abovebar,
color=color.new(color.red, 0), size=size.normal, text="🔻 SELL", textcolor=color.white)