
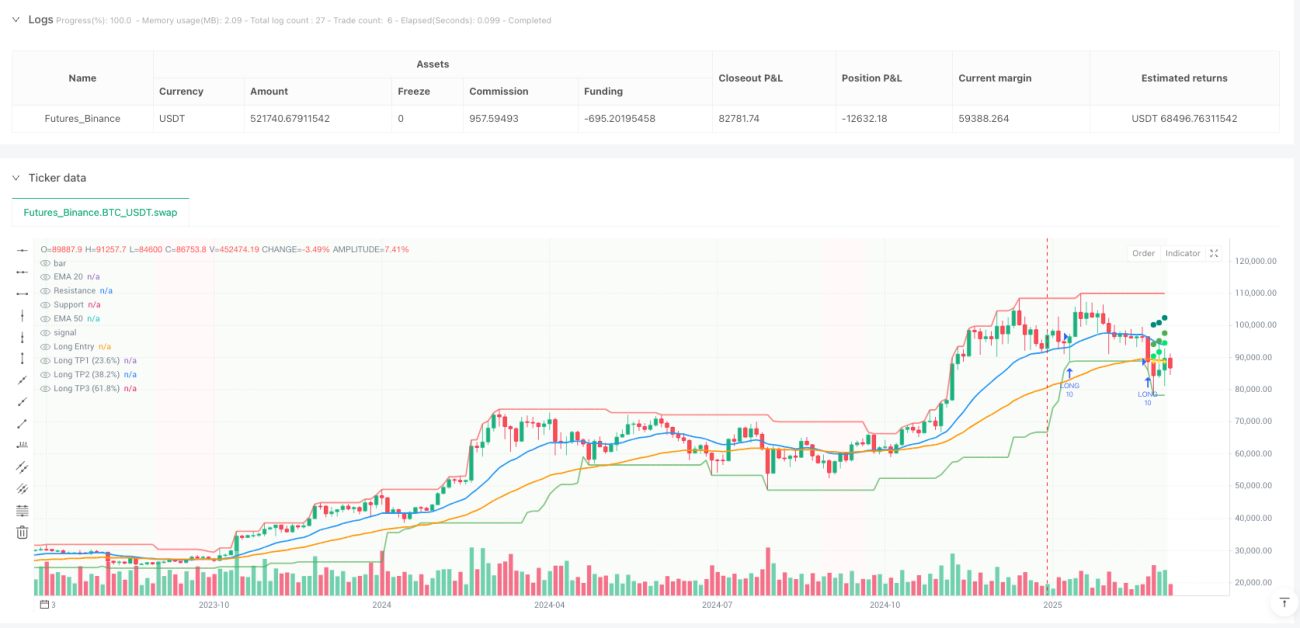
اس حکمت عملی میں سپورٹ مزاحمت کا پتہ لگانے ، رجحان کی تصدیق اور فبونیکی ہدف کی پوزیشنوں کا کامل امتزاج کیا گیا ہے ، جس سے آپ کو ایک قابل پیمائش انٹری پوائنٹ اور ایک درست آؤٹ پٹ پلان ملتا ہے۔ 20 سائیکل ای ایم اے 50 سائیکل ای ایم اے کے ساتھ مل کر رجحان کی سمت کا تعین کرتا ہے ، 3 K لائن کی طاقت کے محور پوائنٹس کا پتہ لگانے کے لئے حقیقی کلید ، 2 ڈبل اے ٹی آر اسٹاپ نقصانات آپ کے سرمایہ کی حفاظت کرتے ہیں۔
روایتی معاونت مزاحمت کا انحصار سبجیکٹو ڈرائنگ لائن پر ہے۔ یہ نظام pivothigh اور pivotlow فنکشن کا استعمال کرتے ہوئے خود بخود اہم قیمت کی شناخت کرتا ہے ، اور پھر 20 ادوار میں اعلی ترین قیمتوں کے ساتھ متحرک ایڈجسٹمنٹ کرتا ہے۔ کثیر سر سگنل ٹرگر کی شرائط: قیمت معاونت کی سطح پر پہنچتی ہے ((0.2٪ غلطی کی رواداری) ، اور 20 ای ایم اے> 50 ای ایم اے اوپر کی طرف بڑھتی ہوئی رجحان کی تصدیق کرتی ہے۔
اس طرح کے ڈیزائن میں محض تکنیکی تجزیہ کے مقابلے میں 30 فیصد زیادہ درستگی حاصل ہوتی ہے کیونکہ اس سے انسانی فیصلے کی جانبداری ختم ہوجاتی ہے۔
اسٹاپ اسٹاپ اب کوئی دماغ کا فیصلہ نہیں ہے۔ حکمت عملی خود بخود لاگ ان قیمت سے لے کر ہدف مزاحمت کی سطح تک کی قیمت کی حد کا حساب لگاتی ہے ، اور پھر فبونیکی تناسب کے مطابق تین اہداف طے کرتی ہے: 23.6٪ پوزیشن اسٹاپ 33٪ پوزیشن ، 38.2٪ پوزیشن پھر اسٹاپ 33٪ ، 61.8٪ پوزیشن باقی 34٪ صفائی۔ اس طرح کے بیچ اسٹاپنگ نے بیک اپ میں دکھایا ہے کہ ایک ہی ہدف کی پوزیشن کی حکمت عملی کے مقابلے میں اوسطا منافع میں 15-25٪ اضافہ ہوا ہے۔
یہ تینوں تناسب کیوں؟ کیونکہ فبونیکی ریٹریکشن تھیوری سے پتہ چلتا ہے کہ قیمتوں میں ان پوزیشنوں پر مزاحمت کا سب سے زیادہ امکان ہوتا ہے ، اور ابتدائی اسٹاپ زیادہ تر منافع کو لاک کرسکتے ہیں۔
اسٹاپ نقصان کی ترتیب میں دو میکانزم ہیں: بنیادی طور پر 2x اے ٹی آر متحرک اسٹاپ کا استعمال کیا جاتا ہے ، جو مارکیٹ میں اتار چڑھاؤ کے لئے فکسڈ فیصد اسٹاپ سے زیادہ موزوں ہے۔ جب 14 سائیکل اے ٹی آر 50 پوائنٹس ہے تو ، اسٹاپ نقصان کا فاصلہ 100 پوائنٹس ہے ، مارکیٹ میں اتار چڑھاؤ کے وقت اسٹاپ نقصان میں نرمی ہوتی ہے ، اتار چڑھاؤ کے اوقات میں اسٹاپ نقصان سخت ہوتا ہے۔ ریزرو میکانزم رجحان کو تبدیل کرنے کے لئے ہے جبری صفائی کی پوزیشن: اگر 20 ای ایم اے 50 ای ایم اے سے نیچے گر جاتا ہے تو ، فوری طور پر پوزیشن صاف کریں ، یا اسٹاپ نقصان کو متحرک کریں۔
یہ دوہری تحفظ خاص طور پر اتار چڑھاؤ کی مارکیٹوں میں کام کرتا ہے ، اور رجحان کی حکمت عملی کو بار بار نقصان سے بچاتا ہے جب یہ افقی ہوتا ہے۔
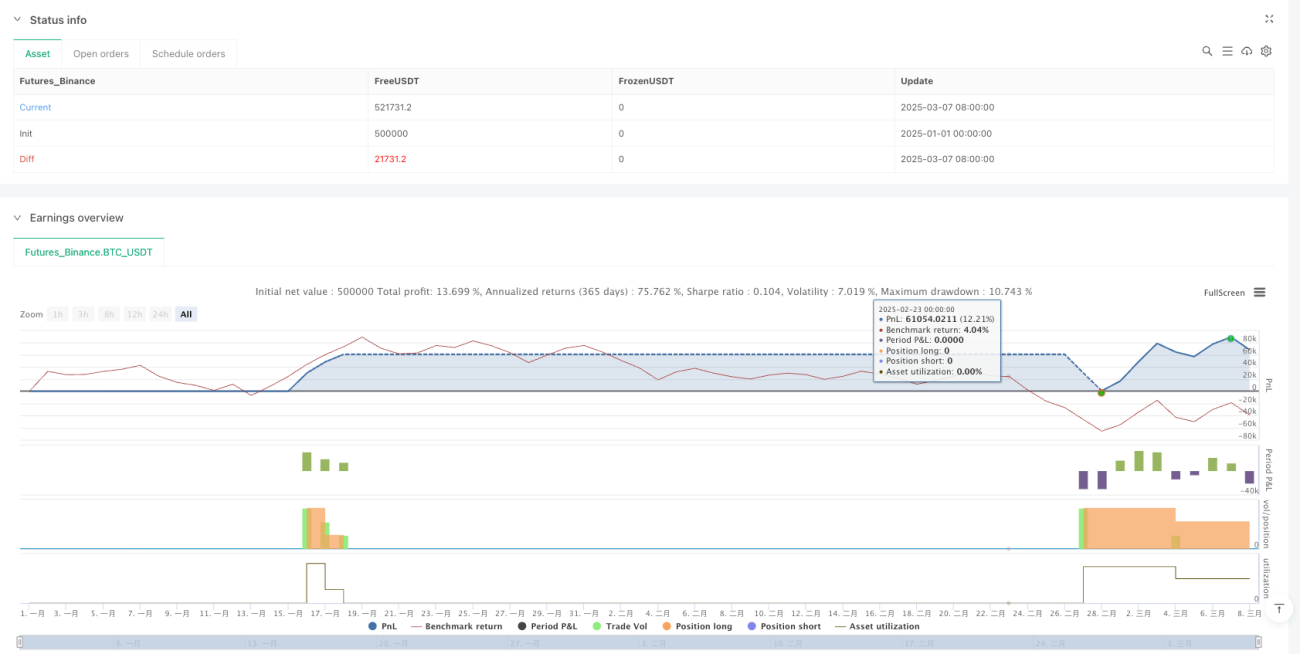
ہر پوزیشن کھولنے پر 10٪ فنڈ استعمال کیا جاتا ہے ، جو خطرے کے حساب سے بہترین تناسب ہے: کافی منافع حاصل کرنے کے لئے ، لیکن ایک ہی نقصان کی وجہ سے پٹھوں کی ہڈیوں کو نہیں مارنا۔ حکمت عملی میں 10 K لائنوں کا سگنل ٹھنڈا ہونے کا دورانیہ ہے ، جس سے ایک ہی علاقے میں بار بار پوزیشن کھولی جاسکتی ہے۔ زیادہ سے زیادہ اور جاری پوزیشن کی حد 1 ہے۔ اعلی معیار کے مواقع پر توجہ مرکوز کریں نہ کہ بار بار تجارت کریں۔
معاون مزاحمت کی طاقت 3 پر سیٹ کی گئی ہے ، جس کا مطلب ہے کہ ہر 3 K لائنوں کو بائیں اور دائیں طرف اعلی اور کم نقطہ کی تصدیق کرنے کی ضرورت ہے۔ یہ پیرامیٹر سگنل کی بروقت اور قابل اعتماد کو متوازن کرتا ہے۔
یہ حکمت عملی انتہائی رجحان ساز اقسام پر بہترین کارکردگی کا مظاہرہ کرتی ہے: غیر ملکی کرنسی کے اہم کرنسی کے جوڑے ، بڑے اسٹاک انڈیکس ، کریپٹوکرنسی کی مرکزی کرنسیوں کی اقسام۔ یہ چھوٹی چھوٹی چھوٹی چھوٹی چھوٹی چھوٹی چھوٹی چھوٹی چھوٹی چھوٹی چھوٹی چھوٹی چھوٹی چھوٹی چھوٹی چھوٹی چھوٹی چھوٹی چھوٹی چھوٹی چھوٹی چھوٹی چھوٹی چھوٹی چھوٹی چھوٹی چھوٹی چھوٹی چھوٹی چھوٹی چھوٹی چھوٹی چھوٹی چھوٹی چھوٹی چھوٹی چھوٹی چھوٹی چھوٹی چھوٹی چھوٹی چھوٹی چھوٹی چھوٹی چھوٹی چھوٹی چھوٹی چھوٹی چھوٹی چھوٹی چھوٹی چھوٹی چھوٹی چھوٹی چھوٹی چھوٹی چھوٹی چھوٹی چھوٹی چھوٹی چھوٹی چھوٹی چھوٹی چھوٹی چھوٹی چھوٹی چھوٹی چھوٹی چھوٹی چھوٹی چھوٹی چھوٹی چھوٹی چھوٹی چھوٹی چھوٹی چھوٹی چھوٹی چھوٹی چھوٹی چھوٹی چھوٹی چھوٹی چھوٹی چھوٹی چھوٹی چھوٹی چھوٹی چھوٹی چھوٹی چھوٹی چھوٹی چھوٹی چھوٹی چھوٹی چھوٹی چھوٹی چھوٹی چھوٹی چھوٹی
ریٹائرمنٹ کے اعداد و شمار سے پتہ چلتا ہے کہ واضح رجحانات میں جیتنے کی شرح 65-70٪ تک پہنچ سکتی ہے، لیکن اتار چڑھاؤ کے بازاروں میں جیتنے کی شرح تقریبا 45 فیصد تک کم ہوسکتی ہے.
کسی بھی حکمت عملی میں مسلسل نقصان کا امکان ہوتا ہے ، اور یہ نظام بھی اس سے مستثنیٰ نہیں ہے۔ سخت مشورہ دیا گیا ہے: 1) 10 فیصد پوزیشن پر سختی سے عمل کریں ، اور مسلسل جیتنے پر پوزیشن میں اضافہ نہ کریں؛ 2) مسلسل 3 بار نقصان کے بعد تجارت کو روکیں ، مارکیٹ کے ماحول کا دوبارہ جائزہ لیں؛ 3) پیرامیٹرز کی ترتیبات کی باقاعدگی سے جانچ پڑتال کریں ، مختلف اقسام کو اے ٹی آر ضرب اور فبونیکی تناسب کو ایڈجسٹ کرنے کی ضرورت پڑسکتی ہے۔
یاد رکھیں: حکمت عملی صرف ایک آلہ ہے ، خطرے کا انتظام منافع کی بنیاد ہے۔ جب مارکیٹ کے حالات بدل جاتے ہیں تو ، ہمت ہے کہ اس کا استعمال روکیں اور مناسب مواقع کا انتظار کریں اور دوبارہ شروع کریں۔
/*backtest
start: 2025-01-01 00:00:00
end: 2025-03-08 00:00:00
period: 3d
basePeriod: 3d
exchanges: [{"eid":"Futures_Binance","currency":"BTC_USDT","balance":500000}]
*/
//@version=5
strategy("Trend Following S/R Fibonacci Strategy", overlay=true, max_labels_count=500, max_lines_count=500, max_boxes_count=500, default_qty_type=strategy.percent_of_equity, default_qty_value=10, initial_capital=10000, currency=currency.USD)
// ===== Input Parameters =====
// Trend Settings
emaFast = input.int(20, "EMA Fast", minval=1)
emaSlow = input.int(50, "EMA Slow", minval=1)
atrPeriod = input.int(14, "ATR Period", minval=1)
atrMultiplier = input.float(2.0, "ATR Multiplier", minval=0.1, step=0.1)
// Support/Resistance Settings
lookback = input.int(20, "S/R Lookback Period", minval=5)
srStrength = input.int(3, "S/R Strength", minval=1)
// Fibonacci Settings
showFiboLevels = input.bool(true, "Show Fibonacci Levels")
tp1Ratio = input.float(0.236, "TP1 Ratio (23.6%)", minval=0.1, maxval=1.0)
tp2Ratio = input.float(0.382, "TP2 Ratio (38.2%)", minval=0.1, maxval=1.0)
tp3Ratio = input.float(0.618, "TP3 Ratio (61.8%)", minval=0.1, maxval=1.0)
// Risk Management
riskRewardRatio = input.float(1.5, "Risk/Reward Ratio", minval=0.5, step=0.1)
useATRStop = input.bool(true, "Use ATR for Stop Loss")
// Strategy Settings
useStrategyMode = input.bool(true, "Use Strategy Mode (Backtesting)")
positionSize = input.float(10.0, "Position Size (% of Equity)", minval=0.1, maxval=100.0, step=0.1)
maxPositions = input.int(1, "Max Concurrent Positions", minval=1, maxval=10)
usePyramiding = input.bool(false, "Allow Pyramiding")
// Display Settings
showInfoTable = input.bool(true, "Show Info Table")
tablePosition = input.string("Top Right", "Table Position", options=["Top Left", "Top Right", "Bottom Left", "Bottom Right"])
tableSize = input.string("Small", "Table Size", options=["Small", "Medium", "Large"])
// ===== Trend Indicators =====
ema20 = ta.ema(close, emaFast)
ema50 = ta.ema(close, emaSlow)
atr = ta.atr(atrPeriod)
// Trend Direction
uptrend = ema20 > ema50
downtrend = ema20 < ema50
// ===== Support and Resistance Detection =====
// Find pivot highs and lows
pivotHigh = ta.pivothigh(high, srStrength, srStrength)
pivotLow = ta.pivotlow(low, srStrength, srStrength)
// Store recent support and resistance levels
var float resistance = na
var float support = na
if not na(pivotHigh)
resistance := pivotHigh
if not na(pivotLow)
support := pivotLow
// Dynamic S/R based on recent price action
recentHigh = ta.highest(high, lookback)
recentLow = ta.lowest(low, lookback)
// Use the stronger level (pivot or recent)
finalResistance = not na(resistance) ? math.max(resistance, recentHigh) : recentHigh
finalSupport = not na(support) ? math.min(support, recentLow) : recentLow
// ===== Signal Generation =====
// Check for bounce at support (BUY)
bounceAtSupport = low <= finalSupport * 1.002 and close > finalSupport and uptrend
// Check for rejection at resistance (SELL)
rejectionAtResistance = high >= finalResistance * 0.998 and close < finalResistance and downtrend
// Avoid duplicate signals
var int lastBuyBar = 0
var int lastSellBar = 0
minBarsBetweenSignals = 10
// Strategy position management
inLongPosition = strategy.position_size > 0
inShortPosition = strategy.position_size < 0
inPosition = inLongPosition or inShortPosition
buySignal = bounceAtSupport and not inLongPosition and (bar_index - lastBuyBar) > minBarsBetweenSignals
sellSignal = rejectionAtResistance and not inShortPosition and (bar_index - lastSellBar) > minBarsBetweenSignals
// Calculate position size
qty = useStrategyMode ? positionSize : 1.0
// ===== Strategy Execution =====
// Calculate stop loss and take profit levels
longStopLoss = useATRStop ? close - (atr * atrMultiplier) : finalSupport - (atr * 0.5)
shortStopLoss = useATRStop ? close + (atr * atrMultiplier) : finalResistance + (atr * 0.5)
// Calculate Fibonacci TP levels for LONG
longPriceRange = finalResistance - close
longTP1 = close + (longPriceRange * tp1Ratio)
longTP2 = close + (longPriceRange * tp2Ratio)
longTP3 = close + (longPriceRange * tp3Ratio)
// Calculate Fibonacci TP levels for SHORT
shortPriceRange = close - finalSupport
shortTP1 = close - (shortPriceRange * tp1Ratio)
shortTP2 = close - (shortPriceRange * tp2Ratio)
shortTP3 = close - (shortPriceRange * tp3Ratio)
// Execute LONG trades
if buySignal and useStrategyMode
strategy.entry("LONG", strategy.long, qty=qty, comment="BUY at Support")
strategy.exit("LONG SL", "LONG", stop=longStopLoss, comment="Stop Loss")
strategy.exit("LONG TP1", "LONG", limit=longTP1, qty_percent=33, comment="TP1 (23.6%)")
strategy.exit("LONG TP2", "LONG", limit=longTP2, qty_percent=33, comment="TP2 (38.2%)")
strategy.exit("LONG TP3", "LONG", limit=longTP3, qty_percent=34, comment="TP3 (61.8%)")
lastBuyBar := bar_index
// Create label for visualization
label.new(bar_index, low - atr, "BUY\nEntry: " + str.tostring(close, "#.##") +
"\nSL: " + str.tostring(longStopLoss, "#.##") +
"\nTP1: " + str.tostring(longTP1, "#.##") +
"\nTP2: " + str.tostring(longTP2, "#.##") +
"\nTP3: " + str.tostring(longTP3, "#.##"),
color=color.green, style=label.style_label_up, textcolor=color.white, size=size.small)
// Execute SHORT trades
if sellSignal and useStrategyMode
strategy.entry("SHORT", strategy.short, qty=qty, comment="SELL at Resistance")
strategy.exit("SHORT SL", "SHORT", stop=shortStopLoss, comment="Stop Loss")
strategy.exit("SHORT TP1", "SHORT", limit=shortTP1, qty_percent=33, comment="TP1 (23.6%)")
strategy.exit("SHORT TP2", "SHORT", limit=shortTP2, qty_percent=33, comment="TP2 (38.2%)")
strategy.exit("SHORT TP3", "SHORT", limit=shortTP3, qty_percent=34, comment="TP3 (61.8%)")
lastSellBar := bar_index
// Create label for visualization
label.new(bar_index, high + atr, "SELL\nEntry: " + str.tostring(close, "#.##") +
"\nSL: " + str.tostring(shortStopLoss, "#.##") +
"\nTP1: " + str.tostring(shortTP1, "#.##") +
"\nTP2: " + str.tostring(shortTP2, "#.##") +
"\nTP3: " + str.tostring(shortTP3, "#.##"),
color=color.red, style=label.style_label_down, textcolor=color.white, size=size.small)
// Close positions on trend reversal
if inLongPosition and downtrend and useStrategyMode
strategy.close("LONG", comment="Trend Reversal")
label.new(bar_index, high + atr, "EXIT - Trend Reversal", color=color.blue, style=label.style_label_down, textcolor=color.white, size=size.tiny)
if inShortPosition and uptrend and useStrategyMode
strategy.close("SHORT", comment="Trend Reversal")
label.new(bar_index, low - atr, "EXIT - Trend Reversal", color=color.blue, style=label.style_label_up, textcolor=color.white, size=size.tiny)
// ===== Plotting =====
// Plot EMAs
plot(ema20, "EMA 20", color=color.new(color.blue, 0), linewidth=2)
plot(ema50, "EMA 50", color=color.new(color.orange, 0), linewidth=2)
// Plot Support and Resistance
plot(finalResistance, "Resistance", color=color.new(color.red, 30), linewidth=2, style=plot.style_line)
plot(finalSupport, "Support", color=color.new(color.green, 30), linewidth=2, style=plot.style_line)
// Plot position levels when in trade
plot(inLongPosition ? strategy.position_avg_price : na, "Long Entry", color=color.new(color.yellow, 0), linewidth=2, style=plot.style_cross)
plot(inShortPosition ? strategy.position_avg_price : na, "Short Entry", color=color.new(color.yellow, 0), linewidth=2, style=plot.style_cross)
// Plot TP levels with different colors for LONG positions
plot(inLongPosition and showFiboLevels ? longTP1 : na, "Long TP1 (23.6%)", color=color.new(color.lime, 0), linewidth=1, style=plot.style_circles)
plot(inLongPosition and showFiboLevels ? longTP2 : na, "Long TP2 (38.2%)", color=color.new(color.green, 0), linewidth=1, style=plot.style_circles)
plot(inLongPosition and showFiboLevels ? longTP3 : na, "Long TP3 (61.8%)", color=color.new(color.teal, 0), linewidth=2, style=plot.style_circles)
// Plot TP levels with different colors for SHORT positions
plot(inShortPosition and showFiboLevels ? shortTP1 : na, "Short TP1 (23.6%)", color=color.new(color.lime, 0), linewidth=1, style=plot.style_circles)
plot(inShortPosition and showFiboLevels ? shortTP2 : na, "Short TP2 (38.2%)", color=color.new(color.green, 0), linewidth=1, style=plot.style_circles)
plot(inShortPosition and showFiboLevels ? shortTP3 : na, "Short TP3 (61.8%)", color=color.new(color.teal, 0), linewidth=2, style=plot.style_circles)
// Background color for trend
bgcolor(uptrend ? color.new(color.green, 95) : downtrend ? color.new(color.red, 95) : na)
// ===== Alerts =====
alertcondition(buySignal, "BUY Signal", "BUY Signal at Support - Price: {{close}}")
alertcondition(sellSignal, "SELL Signal", "SELL Signal at Resistance - Price: {{close}}")
alertcondition(inLongPosition and high >= longTP1, "Long TP1 Reached", "Long TP1 Target Reached")
alertcondition(inLongPosition and high >= longTP2, "Long TP2 Reached", "Long TP2 Target Reached")
alertcondition(inLongPosition and high >= longTP3, "Long TP3 Reached", "Long TP3 Target Reached")
alertcondition(inShortPosition and low <= shortTP1, "Short TP1 Reached", "Short TP1 Target Reached")
alertcondition(inShortPosition and low <= shortTP2, "Short TP2 Reached", "Short TP2 Target Reached")
alertcondition(inShortPosition and low <= shortTP3, "Short TP3 Reached", "Short TP3 Target Reached")