سوئنگ شناخت اسکورنگ حکمت عملی

یہ کوئی عام سویئنگ اسٹریٹیجی نہیں، بلکہ AI اسکورنگ پر مبنی ایک درست نشانہ بازی کا نظام ہے
روایتی سویئنگ اسٹریٹیجی کا مسئلہ کیا ہے؟ سگنلز بہت زیادہ ہوتے ہیں، معیار میں یکسانیت نہیں ہوتی، اور جھوٹے بریک آؤٹ کثرت سے ہوتے ہیں۔ یہ اسٹریٹیجی براہ راست اصل مسئلے کو حل کرتی ہے: ہر سگنل کو 1 سے 5 تک کا کوالٹی اسکور ملتا ہے، اور صرف 4 یا اس سے زیادہ اسکور والے اعلیٰ معیار کے سگنلز پر ٹریڈ کی جاتی ہے۔
بنیادی منطق سادہ اور براہ راست ہے: Higher Low (اونچی لو) اور Lower High (نیچی ہائی) کی پہچان کریں، اور پھر 4 مختلف جہتوں پر سگنلز کو اسکور کریں۔ کم از کم 4 اسکور ہو تبھی پوزیشن کھولی جائے، جس سے 80% بیکار سگنلز خود بخود فلٹر ہو جاتے ہیں۔
5 جہتی اسکورنگ سسٹم ایک ہی انڈیکیٹر سے بہتر کیوں ہے؟
بنیادی 1 اسکور: سویئنگ پیٹرن کی موجودگی کی تصدیق
حجم کی تصدیق +1 اسکور: ٹریڈنگ حجم 20 پیریڈ کی اوسط سے 1.2 گنا زیادہ ہو، جو ظاہر کرتا ہے کہ پیسہ اس میں شامل ہے
RSI پوزیشن +1 اسکور: RSI 30-70 کی حد میں ہو، جو زیادہ خریدی یا زیادہ فروخت ہونے والے جھوٹے سگنلز سے بچاتا ہے
کینڈل باڈی +1 اسکور: باڈی کا تناسب 60% سے زیادہ ہو، اس بات کو یقینی بناتا ہے کہ یہ ڈوجی جیسی غیر فیصلہ کن شکلیں نہ ہوں
ٹرینڈ کی سیدھ +1 اسکور: قیمت، MA20، اور MA50 تینوں ایک ہی سمت میں ہوں
نتیجہ: 5 اسکور کے مکمل سگنلز کی جیت کی شرح سب سے زیادہ ہوتی ہے، 4 اور اس سے اوپر کے سگنلز پر ٹریڈ کی جا سکتی ہے، جبکہ 3 اور اس سے نیچے کے سگنلز کو نظر انداز کر دیا جاتا ہے۔
سٹاپ لوس ڈیزائن: 10 پیریڈ کی انتہائی قیمت، من مانی ATR نہیں
سٹاپ لوس کی منطق بہت واضح ہے:
- لمبی پوزیشن کے لیے سٹاپ لوس = پچھلی 10 کینڈلز کی کم ترین قیمت
- چھوٹی پوزیشن کے لیے سٹاپ لوس = پچھلی 10 کینڈلز کی بلند ترین قیمت
10 پیریڈ کیوں؟ کیونکہ سویئنگ اسٹریٹیجی بنیادی طور پر قلیل مدتی ریورسل پکڑنے کے لیے ہوتی ہے، 10 پیریڈ قیمت کو سانس لینے کے لیے کافی جگہ دیتے ہیں، اور ساتھ ہی سٹاپ لوس کا فاصلہ بھی بہت زیادہ نہیں ہونے دیتے۔ یہ ایک مقررہ ATR ضرب سے مارکیٹ کی ساخت کے ساتھ زیادہ ہم آہنگ ہے۔
ناکام سگنل بھی ٹریڈنگ کے مواقع ہوتے ہیں
یہ اسٹریٹیجی "ناکام سویئنگ" کو بھی پہچانتی ہے:
- Higher Low کی ناکامی: اونچی لو بننے کے بعد پھر سے نیچے ٹوٹنا
- Lower High کی ناکامی: نیچی ہائی بننے کے بعد پھر سے اوپر ٹوٹنا
یہ ناکامیاں اکثر ٹرینڈ کی رفتار بڑھنے کا اشارہ دیتی ہیں، اور ریورس ٹریڈنگ کے لیے بہترین مواقع ہوتے ہیں۔
لگاتار سگنل = ٹرینڈ کی تصدیق
جب لگاتار دو کینڈلز ایک ہی سمت میں تصدیق شدہ سگنل دکھائی دیں، تو انہیں ہیرے کے نشان سے ظاہر کیا جاتا ہے۔ اس کا عام طور پر مطلب ہوتا ہے:
- لگاتار تیزی: تیزی کا رجحان قائم ہو گیا
- لگاتار مندی: مندی کا رجحان قائم ہو گیا
لگاتار سگنلز کی جیت کی شرح عام طور پر علیحدہ سگنلز کے مقابلے میں 15-20% زیادہ ہوتی ہے۔
استعمال کے مواقع: تھوڑا تیزی یا تھوڑا مندی والی مارکیٹ
بہترین کارکردگی کے ماحول:
- وہ مارکیٹ جہاں واضح رجحان ہو لیکن بار بار اصلاح آتی ہو
- معتدل اتار چڑھاؤ (نہ انتہائی پرسکون اور نہ انتہائی تیز)
- وہ مصنوعات جہاں حجم نسبتاً مستحکم ہو
جن حالات میں استعمال سے گریز کریں:
- یک طرفہ تیزی یا یک طرفہ مندی (سویئنگ سگنلز بار بار ٹوٹیں گے)
- بہت کم اتار چڑھاؤ والا سائیڈ وے مارکیٹ (سگنلز نایاب اور کم معیار کے ہوتے ہیں)
- بہت غیر مستحکم حجم والی غیر معروف مصنوعات
خطرے کی تنبیہ: تاریخی بیک ٹیسٹنگ مستقبل کے منافع کی ضمانت نہیں
واضح خطرات:
- اسٹریٹیجی میں لگاتار نقصان کا امکان ہے، خاص طور پر رجحان کی تبدیلی کے دوران
- اگرچہ 4 اور اس سے اوپر کے سگنلز کا معیار زیادہ ہے، لیکن پھر بھی 30-40% ناکامی کی شرح ہوتی ہے
- سٹاپ لوس نسبتاً ڈھیلا ہے، اس لیے ایک بار کا نقصان بڑا ہو سکتا ہے
- مختلف مارکیٹ ماحول میں کارکردگی میں واضح فرق ہوتا ہے
سرمایہ کے انتظام کی تجویز: ایک بار کا خطرہ اکاؤنٹ کے 2% سے زیادہ نہ ہو، لگاتار 3 بار نقصان کے بعد ٹریڈنگ روک دیں اور مارکیٹ کے ماحول کا دوبارہ جائزہ لیں۔
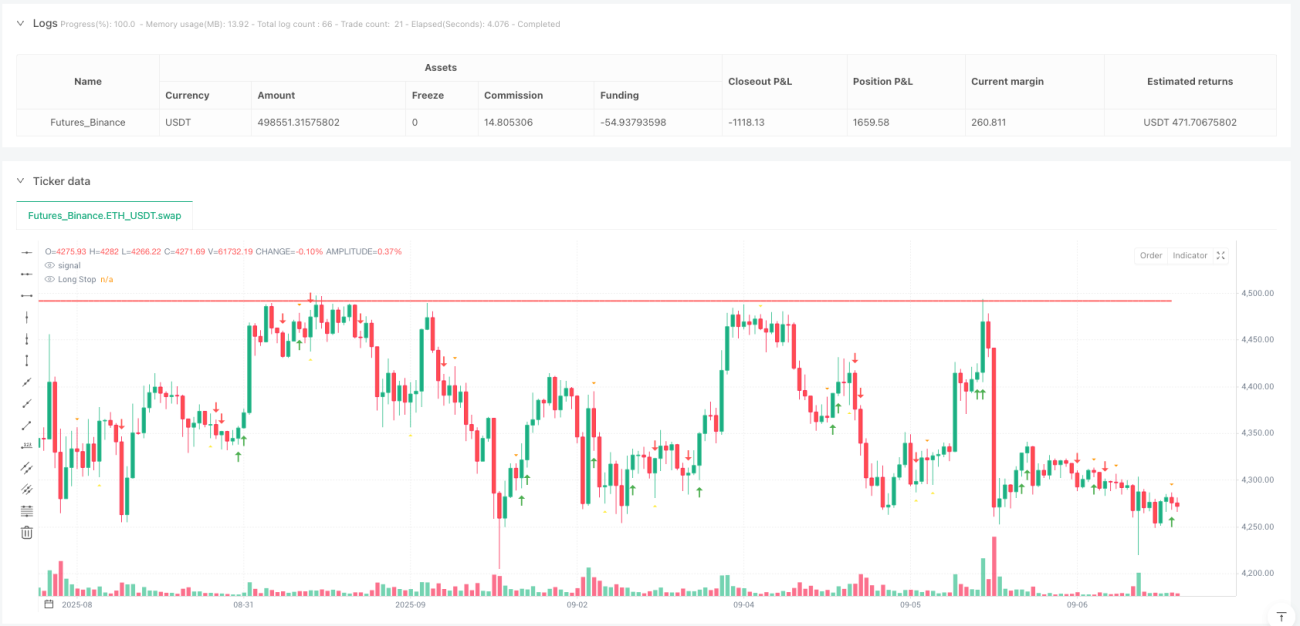
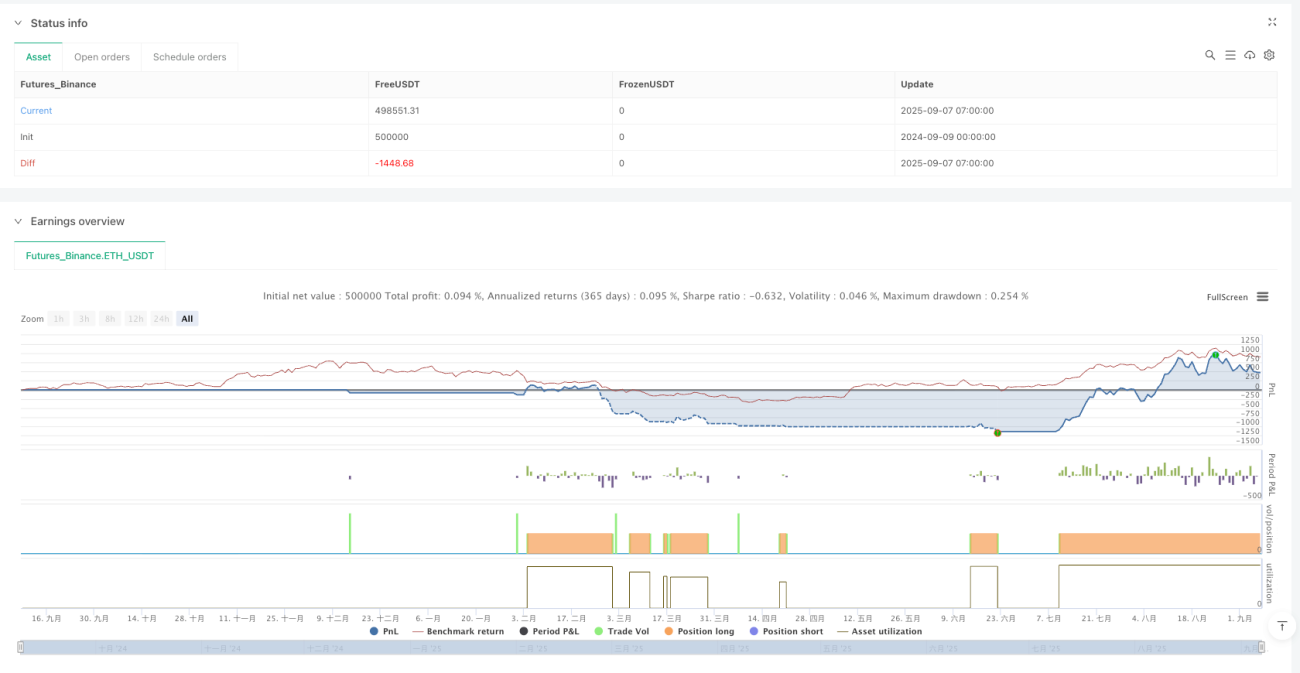
/*backtest
start: 2024-09-09 00:00:00
end: 2025-09-07 08:00:00
period: 1h
basePeriod: 1h
exchanges: [{"eid":"Futures_Binance","currency":"ETH_USDT","balance":500000}]
*/

//@version=6
strategy("Higher Lows, Lower Highs & Failures with Signal Quality Scoring", overlay=true)

// --- Higher Low detection ---- 1