دادی جیسی سادہ سمارٹ منی حکمت عملی

کیا یہ وہی مشہور FVG حکمت عملی ہے؟
"گرینی اسٹریٹیجی" کے نام سے دھوکہ نہ کھائیں۔ یہ حکمت عملی اگرچہ "دادی اماں" کی حکمت عملی کہلاتی ہے، لیکن اس میں تکنیکی مہارت کسی بھی طرح کم نہیں۔ بنیادی منطق: 50 دورانیے کا EMA رجحان کی سمت متعین کرتا ہے + فیئر ویلیو گیپ (FVG) الٹ جانے کے مواقع پکڑتا ہے + 2 گنا رسک ریوارڈ ریشیو منافع کو یقینی بناتا ہے۔ بیک ٹیسٹنگ سے پتہ چلتا ہے کہ یہ واضح رجحان والی مارکیٹوں میں بہترین کارکردگی دکھاتا ہے، لیکن داخلے کی شرائط پر سختی سے عمل کرنا ضروری ہے۔
اس حکمت عملی کی سب سے بڑی خوبی: صرف 4 کینڈلز کے ذریعے داخلے کے وقت کی درست نشاندہی۔ C0-C1 FVG گیپ بناتے ہیں، C2 لیکویڈیٹی صاف کرکے واپس آتا ہے، اور C3 الٹ جانے کے سگنل کی تصدیق کرتا ہے۔ یہ ڈیزائن روایتی بریک آؤٹ حکمت عملیوں سے کہیں زیادہ درست ہے اور جعلی بریک آؤٹ کے بہت سے جالوں سے بچاتا ہے۔
EMA سمت فلٹر: رجحان آپ کا بہترین دوست ہے
50 دورانیے کا EMA کوئی دکھاوے کی چیز نہیں، بلکہ زندگی اور موت کا فیصلہ ہے۔ حکمت عملی لازمی قرار دیتی ہے کہ تیزی کا سگنل EMA کے اوپر اور مندی کا سگنل EMA کے نیچے ہو۔ یہ ڈیزائن 70% مخالف رجحان والی ٹریڈز کو فلٹر کرکے جیت کی شرح کو نمایاں طور پر بڑھاتا ہے۔
سب سے ذہین بات یہ ہے کہ آپ C0، C1، C2 یا C3 میں سے کسی بھی کینڈل کی اختتامی قیمت کو استعمال کرتے ہوئے EMA کی سمت کا فیصلہ کر سکتے ہیں۔ ڈیفالٹ میں C0 (سب سے پرانی کینڈل) چیک کی جاتی ہے، اس بات کو یقینی بنانے کے لیے کہ پوری شکل صحیح رجحان کی سمت میں ہو۔ اگر آپ زیادہ جارحانہ بننا چاہتے ہیں تو C3 کا انتخاب کر سکتے ہیں، جس سے داخلے کے زیادہ مواقع ملیں گے لیکن زیادہ خطرہ ہوگا۔
رسک مینجمنٹ: 2R ہدف + متحرک لاگت بچانے کا طریقہ کار
اسٹاپ لوس بہت درست طریقے سے لگایا جاتا ہے
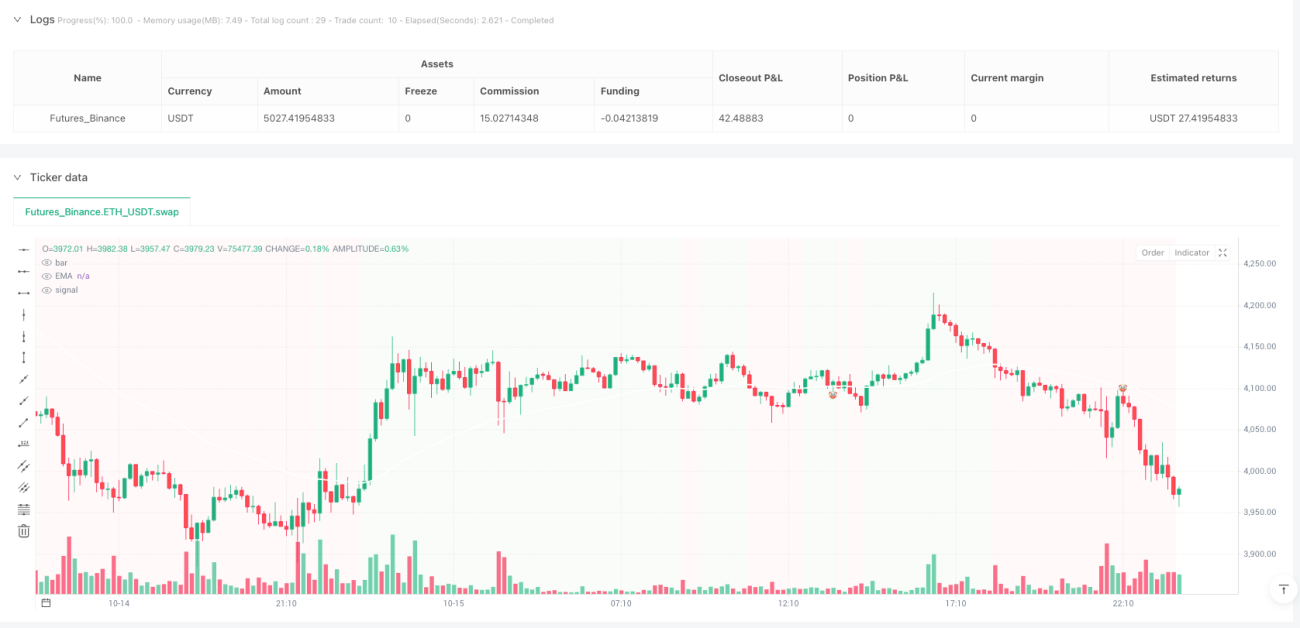
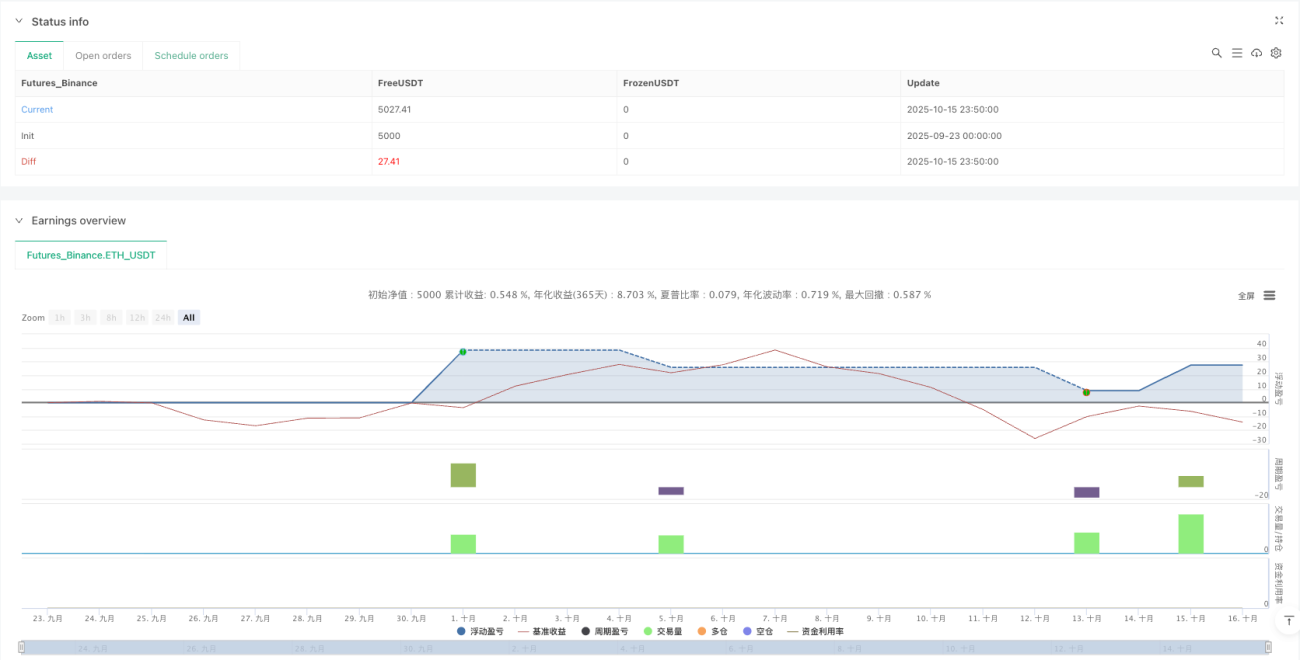
/*backtest
start: 2025-09-23 00:00:00
end: 2025-10-16 00:00:00
period: 10m
basePeriod: 10m
exchanges: [{"eid":"Futures_Binance","currency":"ETH_USDT","balance":5000}]
*/

// This Pine Script® code is subject to the terms of the Mozilla Public License 2.0 at https://mozilla.org/MPL/2.0/
// © rdjxyz

//@version=5- 1