سونے کی لیکویڈیٹی ہنٹر حکمت عملی

🎯 یہ حکمت عملی دراصل کیا کرتی ہے؟
کیا آپ جانتے ہیں؟ مارکیٹ میں کچھ "سمارٹ منی" ہوتی ہے جو اہم پوزیشنوں پر ہمیشہ جال بچھانا پسند کرتی ہے! یہ حکمت عملی ایک تجربہ کار شکاری کی طرح ہے، جو خاص طور پر ان جالوں کو پہچانتی ہے اور ان کے برعکس کام کرتی ہے۔ سادہ الفاظ میں، جب قیمت جان بوجھ کر اہم سپورٹ اور ریزسٹنس لیولز کو "جھوٹا بریک آؤٹ" کرکے فوری واپس آتی ہے، تو ہم بڑی سرمایہ کاری کے بہاؤ کے ساتھ مارکیٹ میں داخل ہوتے ہیں!
📊 تین گنا فلٹر سسٹم کی حقیقت
یاد رکھیں! یہ حکمت عملی تین حفاظتی تہوں کا استعمال کرتی ہے:
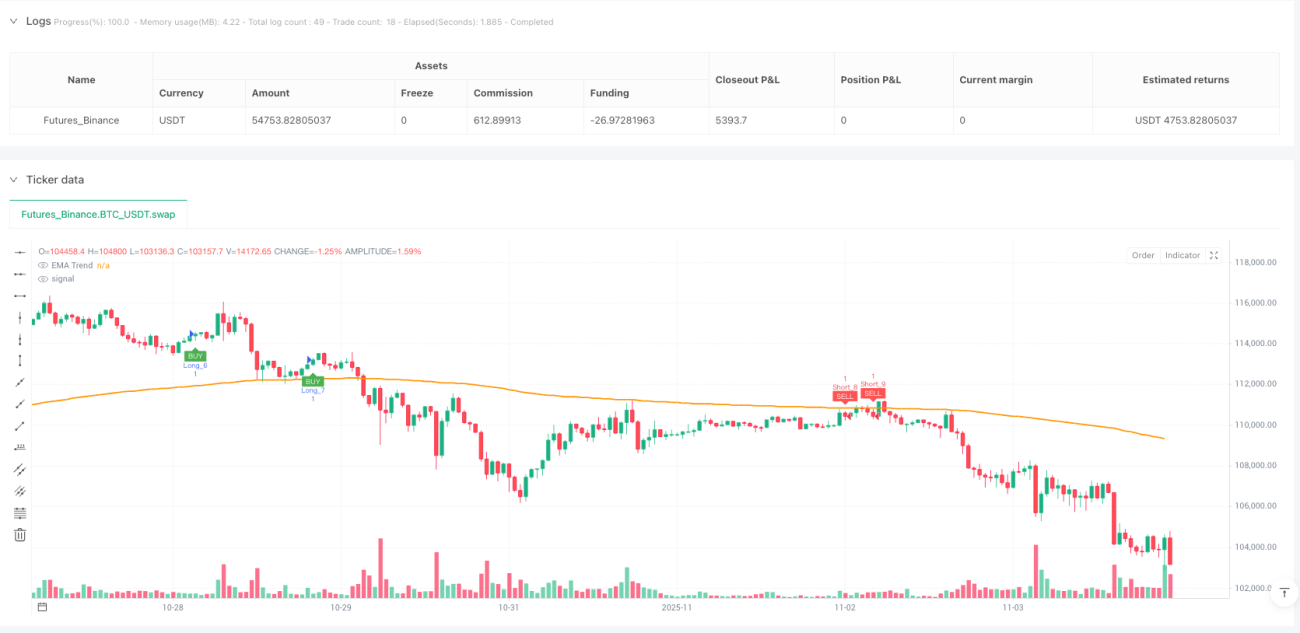
🔸 ٹرینڈ فلٹر: 200 پیریڈ کا EMA ایک تجربہ کار ڈرائیور کی طرح ہے، جو بتاتا ہے کہ اب اوپر کا راستہ ہے یا نیچے کا
🔸 اہم سطحوں کی پہچان: خود بخود ان "جنگی میدانوں" کی سپورٹ اور ریزسٹنس لیولز تلاش کرتا ہے
🔸 لیکویڈیٹی سویپ کا پتہ لگانا: بڑی سرمایہ کاری کی جانب سے جان بوجھ کر بنائے گئے "جعلی اقدامات" کو پکڑتا ہے
یہ بالکل مچھلی پکڑنے کی طرح ہے، آپ کو معلوم ہونا چاہیے کہ مچھلی کہاں ہے، کس قسم کا چارہ ڈالنا ہے، اور کب جال کھینچنا ہے!
🎪 لیکویڈیٹی سویپ کا جادوئی اثر
تصور کریں: آپ دودھ کی چائے لینے کے لیے قطار میں کھڑے ہیں، اچانک کوئی چلاتا ہے "مفت دے رہے ہیں!" سب وہاں بھاگتے ہیں، لیکن یہ جھوٹا نکلا، مگر عقلمند لوگ اس افراتفری میں آگے نکل جاتے ہیں۔
مارکیٹ بھی یہی کرتی ہے! قیمت پہلے "جعلی طور پر" سپورٹ لیول کو توڑتی ہے (اسٹاپ لاس آرڈرز کو صاف کرنے کے لیے)، پھر تیزی سے واپس آتی ہے، یہ داخلے کا بہترین موقع ہوتا ہے۔ حکمت عملی 0.6 گنا ATR کا بفر رکھتی ہے تاکہ یہ یقینی ہو کہ یہ واقعی "سویپ" ہے نہ کہ اصلی بریک آؤٹ۔
⚡ رسک کنٹرول: 1:2 کا سنہری تناسب
مسائل سے بچنے کے رہنما اصول: بہت سے لوگ تجارت اس طرح کرتے ہیں جیسے گاڑی چلاتے ہوئے سیٹ بیلٹ نہیں باندھتے، یہ حکمت عملی 1:2 کے رسک ریوارڈ تناسب کو لازمی قرار دیتی ہے!
- سٹاپ لاس کلیدی سطح سے 0.5 گنا ATR نیچے رکھا جاتا ہے
- ٹیک پرافٹ سٹاپ لاس سے 2 گنا دور ہوتا ہے
- چاہے جیتنے کی شرح صرف 40% ہو، طویل مدت میں منافع ممکن ہے!
🚀 عملی استعمال کے لیے مفید مشورے
یہ حکمت عملی 15 منٹ کے ٹائم فریم پر سونے (گولڈ) کی ٹریڈنگ کے لیے بہترین ہے، کیوں؟ کیونکہ سونے کی مارکیٹ میں لیکویڈیٹی زیادہ ہے، جھوٹے بریک آؤٹ واضح ہوتے ہیں، اور 15 منٹ کا ٹائم فریم بہت زیادہ شور کو فلٹر کر دیتا ہے۔
یاد رکھیں: لالچ نہ کریں! حکمت عملی نے آپ کے لیے اچھی پوزیشن تلاش کر لی ہے، باقی کام مارکیٹ اور وقت پر چھوڑ دیں۔
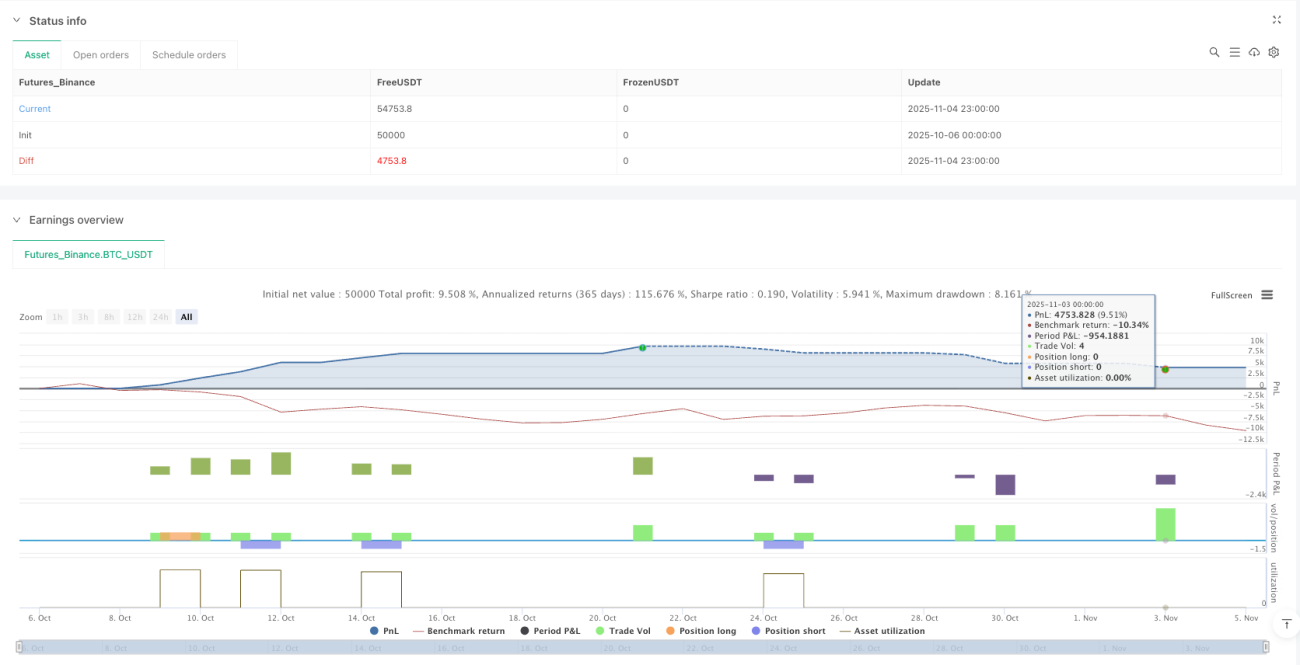
/*backtest
start: 2025-10-06 00:00:00
end: 2025-11-05 00:00:00
period: 1h
basePeriod: 1h
exchanges: [{"eid":"Futures_Binance","currency":"BTC_USDT"}]
*/

//@version=6
strategy("Gold 15m: Trend + S/R + Liquidity Sweep (RR 1:2)", overlay=true, default_qty_type=strategy.fixed, default_qty_value=1, commission_type=strategy.commission.percent, commission_value=0.0)

// ---------------------- INPUTS ----------------------- 1