Chiến lược Breakout Trailing Stop V2


Ngày tạo: 2023-10-24 16:30:32 sửa đổi lần cuối: 2023-10-24 16:30:32
sao chép: 0 Số nhấp chuột: 1615
1
tập trung vào
1617
Người theo dõi

Chiến lược Breakout Trailing Stop V2

Tổng quan

Chiến lược này kết hợp các ưu điểm của chiến lược phá vỡ và chiến lược theo dõi xu hướng để nắm bắt các tín hiệu phá vỡ kháng cự hỗ trợ trong đồ thị đường dài, đồng thời sử dụng đường trung bình di chuyển để theo dõi lỗ hổng, thực hiện lợi nhuận theo hướng của xu hướng đường dài và kiểm soát rủi ro.

Nguyên tắc chiến lược

  1. Chiến lược này bắt đầu bằng việc tính toán các đường trung bình di chuyển của nhiều nhóm các tham số khác nhau, được sử dụng để xác định xu hướng, hỗ trợ kháng cự và theo dõi dừng lỗ.

  2. Sau đó tìm ra các điểm cao nhất và thấp nhất trong chu kỳ được chỉ định làm vùng kháng cự hỗ trợ để vào sân. Khi giá vượt qua các kháng cự hỗ trợ này, tín hiệu sẽ được tạo ra.

  3. Chiến lược mua với điểm phá vỡ cao nhất để thực hiện nhiều tín hiệu, bán với điểm phá vỡ thấp nhất để thực hiện tín hiệu ngắn.

  4. Sau khi tham gia, bạn sẽ giữ vị trí với mức thấp nhất của điểm phá vỡ thấp nhất là điểm dừng lỗ.

  5. Khi vị trí đi vào trạng thái thắng lợi, điểm dừng sẽ chuyển sang theo dõi đường trung bình di chuyển. Khi giá giảm xuống đường trung bình di chuyển, điểm dừng sẽ được thiết lập là điểm thấp nhất của đường K.

  6. Do đó, bạn có thể khóa lợi nhuận, trong khi vẫn có đủ không gian để theo dõi xu hướng.

  7. Chiến lược đồng thời thêm vào biến động thực tế trung bình để đảm bảo chỉ mua phá vỡ trong phạm vi thích hợp và tránh phá vỡ quá mức mở rộng.

Phân tích lợi thế chiến lược

  1. Lợi thế kép của chiến lược phá vỡ và chiến lược theo dõi xu hướng.

  2. Có thể mua một đợt phá vỡ dựa trên xu hướng đường dài, tăng khả năng kiếm lợi nhuận.

  3. Chiến lược dừng lỗ bảo vệ vị trí và cho vị trí đủ chỗ để hoạt động.

  4. Thêm bộ lọc biến động để tránh đột phá bất lợi.

  5. Giao dịch tự động, phù hợp với phần thời gian thanh toán.

  6. Có thể tùy chỉnh hoạt động theo đường trung bình khác nhau.

  7. Có thể điều chỉnh theo dõi dừng lỗ một cách linh hoạt

Phân tích rủi ro chiến lược

  1. Chiến lược đột phá có nguy cơ đột phá giả. Việc xác nhận đột phá có thể được nới lỏng thích hợp.

  2. Cần có đủ sự dao động để tạo ra một tín hiệu đột phá, dễ bị vô hiệu hóa trong tình huống đảo ngược.

  3. Một số đột phá có thể quá ngắn để không thể nắm bắt được.

  4. Tracking Stop Loss có thể bị ngắt quá thường xuyên trong các trường hợp chấn động.

  5. Bộ lọc tỷ lệ dao động có thể bỏ lỡ một số cơ hội. Bạn có thể giảm tham số lọc.

Hướng tối ưu hóa chiến lược

  1. Kiểm tra các kết hợp tham số trung bình khác nhau để tìm tham số tối ưu.

  2. Kiểm tra các cơ chế xác nhận đột phá khác nhau, chẳng hạn như đường dẫn, hình dạng đường K.

  3. Hãy thử các phương pháp theo dõi lỗ hổng khác nhau để tìm ra lỗ hổng tốt nhất.

  4. Tối ưu hóa các chiến lược quản lý tài chính, chẳng hạn như điểm position.

  5. Thêm bộ lọc các chỉ số kỹ thuật thống kê, nâng cao độ chính xác của bộ lọc.

  6. Kiểm tra hiệu quả của chiến lược này với các giống khác nhau.

  7. Tham gia thuật toán học máy để tăng hiệu quả chiến lược.

Tóm tắt

Chiến lược này tích hợp tư duy phá vỡ và theo dõi xu hướng để dừng lỗ, có thể tối ưu hóa không gian lợi nhuận với giả định rằng đánh giá đường dài là đúng. Điều quan trọng là tìm ra sự kết hợp các tham số tốt nhất và phối hợp với chiến lược quản lý tiền tốt để nắm bắt cơ hội đường dài đồng thời thực hiện rủi ro có thể kiểm soát được. Chiến lược này có khả năng trở thành chiến lược xu hướng đường dài đáng tin cậy hơn bằng cách tối ưu hóa hơn nữa.
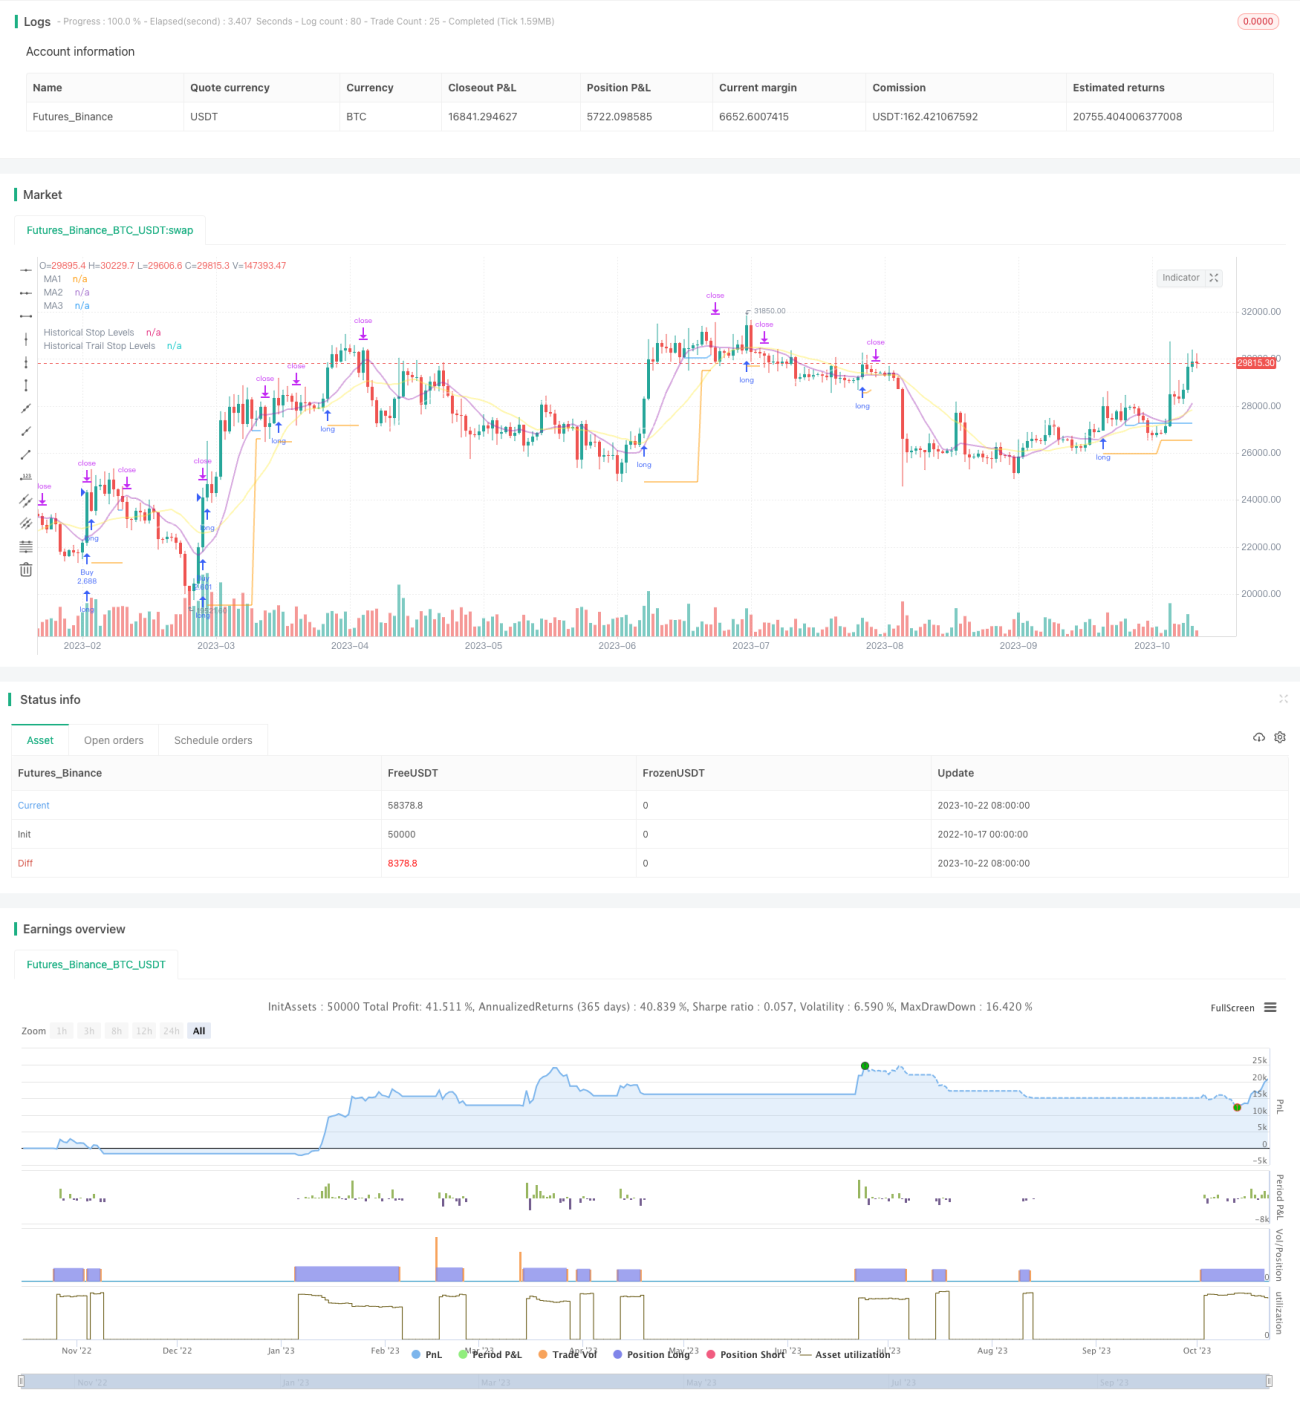
Mã nguồn chiến lược
/*backtest
start: 2022-10-17 00:00:00
end: 2023-10-23 00:00:00
period: 1d
basePeriod: 1h
exchanges: [{"eid":"Futures_Binance","currency":"BTC_USDT"}]
*/

// This source code is subject to the terms of the Mozilla Public License 2.0 at https://mozilla.org/MPL/2.0/
// © millerrh

// The intent of this strategy is to buy breakouts with a tight stop on smaller timeframes in the direction of the longer term trend.
// Then use a trailing stop of a close below either the 10 MA or 20 MA (user choice) on that larger timeframe as the position 
// moves in your favor (i.e. whenever position price rises above the MA).
// Option of using daily ADR as a measure of finding contracting ranges and ensuring a decent risk/reward.
// (If the difference between the breakout point and your stop level is below a certain % of ATR, it could possibly find those consolidating periods.)
// V2 - updates code of original Qullamaggie Breakout to optimize and debug it a bit - the goal is to remove some of the whipsaw and poor win rate of the 
// original by incorporating some of what I learned in the Breakout Trend Follower script.

//@version=4
strategy("Qullamaggie Breakout V2", overlay=true, initial_capital=100000, currency='USD', calc_on_every_tick = true,
   default_qty_type=strategy.percent_of_equity, default_qty_value=100, commission_type=strategy.commission.percent, commission_value=0.1)
   
// === BACKTEST RANGE ===
Start = input(defval = timestamp("01 Jan 2019 06:00 +0000"), title = "Backtest Start Date", type = input.time, group = "backtest window and pivot history")
Finish = input(defval = timestamp("01 Jan 2100 00:00 +0000"), title = "Backtest End Date", type = input.time, group = "backtest window and pivot history")

// Inputs
showPivotPoints = input(title = "Show Historical Pivot Points?", type = input.bool, defval = false, group = "backtest window and pivot history",
  tooltip = "Toggle this on to see the historical pivot points that were used.  Change the Lookback Periods to adjust the frequency of these points.")
htf = input(defval="D", title="Timeframe of Moving Averages", type=input.resolution, group = "moving averages",
  tooltip = "Allows you to set a different time frame for the moving averages and your trailing stop.
  The default behavior is to identify good tightening setups on a larger timeframe
  (like daily) and enter the trade on a breakout occuring on a smaller timeframe, using the moving averages of the larger timeframe to trail your stop.")
maType = input(defval="SMA", options=["EMA", "SMA"], title = "Moving Average Type", group = "moving averages")
ma1Length = input(defval = 10, title = "1st Moving Average Length", minval = 1, group = "moving averages")
ma2Length = input(defval = 20, title = "2nd Moving Average Length", minval = 1, group = "moving averages")
ma3Length = input(defval = 50, title = "3rd Moving Average Length", minval = 1, group = "moving averages")
useMaFilter = input(title = "Use 3rd Moving Average for Filtering?", type = input.bool, defval = true, group = "moving averages",
  tooltip = "Signals will be ignored when price is under this slowest moving average.  The intent is to keep you out of bear periods and only
             buying when price is showing strength or trading with the longer term trend.")
trailMaInput = input(defval="1st Moving Average", options=["1st Moving Average", "2nd Moving Average"], title = "Trailing Stop", group = "stops",
  tooltip = "Initial stops after entry follow the range lows.  Once in profit, the trade gets more wiggle room and
  stops will be trailed when price breaches this moving average.")
trailMaTF = input(defval="Same as Moving Averages", options=["Same as Moving Averages", "Same as Chart"], title = "Trailing Stop Timeframe", group = "stops",
  tooltip = "Once price breaches the trail stop moving average, the stop will be raised to the low of that candle that breached. You can choose to use the
  chart timeframe's candles breaching or use the same timeframe the moving averages use. (i.e. if daily, you wait for the daily bar to close before setting
  your new stop level.)")
currentColorS = input(color.new(color.orange,50), title = "Current Range S/R Colors:    Support", type = input.color, group = "stops", inline = "lineColor")
currentColorR = input(color.new(color.blue,50), title = " Resistance", type = input.color, group = "stops", inline = "lineColor")

// Pivot lookback
lbHigh = 3
lbLow = 3

// MA Calculations (can likely move this to a tuple for a single security call!!)
ma(maType, src, length) =>
    maType == "EMA" ? ema(src, length) : sma(src, length) //Ternary Operator (if maType equals EMA, then do ema calc, else do sma calc)
ma1 = security(syminfo.tickerid, htf, ma(maType, close, ma1Length))
ma2 = security(syminfo.tickerid, htf, ma(maType, close, ma2Length))
ma3 = security(syminfo.tickerid, htf, ma(maType, close, ma3Length))

plot(ma1, color=color.new(color.purple, 60), style=plot.style_line, title="MA1", linewidth=2)
plot(ma2, color=color.new(color.yellow, 60), style=plot.style_line, title="MA2", linewidth=2)
plot(ma3, color=color.new(color.white, 60), style=plot.style_line, title="MA3", linewidth=2)

// === USE ADR FOR FILTERING ===
// The idea here is that you want to buy in a consolodating range for best risk/reward. So here you can compare the current distance between 
// support/resistance vs. the ADR and make sure you aren't buying at a point that is too extended.
useAdrFilter = input(title = "Use ADR for Filtering?", type = input.bool, defval = false, group = "adr filtering",
  tooltip = "Signals will be ignored if the distance between support and resistance is larger than a user-defined percentage of ADR (or monthly volatility
  in the stock screener). This allows the user to ensure they are not buying something that is too extended and instead focus on names that are consolidating more.")
adrPerc = input(defval = 120, title = "% of ADR Value", minval = 1, group = "adr filtering")
tableLocation = input(defval="Bottom", options=["Top", "Bottom"], title = "ADR Table Visibility", group = "adr filtering",
  tooltip = "Place ADR table on the top of the pane, the bottom of the pane, or off.")
adrValue = security(syminfo.tickerid, "D", sma((high-low)/abs(low) * 100, 21)) // Monthly Volatility in Stock Screener (also ADR)
adrCompare = (adrPerc * adrValue) / 100

// === PLOT SWING HIGH/LOW AND MOST RECENT LOW TO USE AS STOP LOSS EXIT POINT ===
ph = pivothigh(high, lbHigh, lbHigh)
pl = pivotlow(low, lbLow, lbLow)
highLevel = valuewhen(ph, high[lbHigh], 0)
lowLevel = valuewhen(pl, low[lbLow], 0)
barsSinceHigh = barssince(ph) + lbHigh
barsSinceLow = barssince(pl) + lbLow
timeSinceHigh = time[barsSinceHigh]
timeSinceLow = time[barsSinceLow]

//Removes color when there is a change to ensure only the levels are shown (i.e. no diagonal lines connecting the levels)
pvthis = fixnan(ph)
pvtlos = fixnan(pl)
hipc = change(pvthis) != 0 ? na : color.new(color.maroon, 0)
lopc = change(pvtlos) != 0 ? na : color.new(color.green, 0)

// Display Pivot lines
plot(showPivotPoints ? pvthis : na, color=hipc, linewidth=1, offset=-lbHigh, title="Top Levels")
plot(showPivotPoints ? pvthis : na, color=hipc, linewidth=1, offset=0, title="Top Levels 2")
plot(showPivotPoints ? pvtlos : na, color=lopc, linewidth=1, offset=-lbLow, title="Bottom Levels")
plot(showPivotPoints ? pvtlos : na, color=lopc, linewidth=1, offset=0, title="Bottom Levels 2")

// BUY AND SELL CONDITIONS
buyLevel = valuewhen(ph, high[lbHigh], 0) //Buy level at Swing High

// Conditions for entry
stopLevel = float(na) // Define stop level here as "na" so that I can reference it in the ADR calculation before the stopLevel is actually defined.
buyConditions = (useMaFilter ? buyLevel > ma3 : true) and
  (useAdrFilter ? (buyLevel - stopLevel[1]) < adrCompare : true) 
buySignal = crossover(high, buyLevel) and buyConditions

// Trailing stop points - when price punctures the moving average, move stop to the low of that candle - Define as function/tuple to only use one security call
trailMa = trailMaInput == "1st Moving Average" ? ma1 : ma2
f_getCross() =>
    maCrossEvent = crossunder(low, trailMa)
    maCross = valuewhen(maCrossEvent, low, 0)
    maCrossLevel = fixnan(maCross)
    maCrossPc = change(maCrossLevel) != 0 ? na : color.new(color.blue, 0) //Removes color when there is a change to ensure only the levels are shown (i.e. no diagonal lines connecting the levels)
    [maCrossEvent, maCross, maCrossLevel, maCrossPc]
crossTF = trailMaTF == "Same as Moving Averages" ? htf : ""
[maCrossEvent, maCross, maCrossLevel, maCrossPc] = security(syminfo.tickerid, crossTF, f_getCross())

plot(showPivotPoints ? maCrossLevel : na, color = maCrossPc, linewidth=1, offset=0, title="Ma Stop Levels")

// == STOP AND PRICE LEVELS ==
inPosition = strategy.position_size > 0
buyLevel := inPosition ? buyLevel[1] : buyLevel
stopDefine = valuewhen(pl, low[lbLow], 0) //Stop Level at Swing Low
inProfit = strategy.position_avg_price <= stopDefine[1]
// stopLevel := inPosition ? stopLevel[1] : stopDefine // Set stop loss based on swing low and leave it there
stopLevel := inPosition and not inProfit ? stopDefine : inPosition and inProfit ? stopLevel[1] : stopDefine // Trail stop loss until in profit
trailStopLevel = float(na)

// trying to figure out a better way for waiting on the trail stop - it can trigger if above the stopLevel even if the MA hadn't been breached since opening the trade
notInPosition = strategy.position_size == 0
inPositionBars = barssince(notInPosition)
maCrossBars = barssince(maCrossEvent)
trailCross = inPositionBars > maCrossBars
// trailCross = trailMa > stopLevel
trailStopLevel := inPosition and trailCross ? maCrossLevel : na

plot(inPosition ? stopLevel : na, style=plot.style_linebr, color=color.new(color.orange, 50), linewidth = 2, title = "Historical Stop Levels", trackprice=false)
plot(inPosition ? trailStopLevel : na, style=plot.style_linebr, color=color.new(color.blue, 50), linewidth = 2, title = "Historical Trail Stop Levels", trackprice=false)

// == PLOT SUPPORT/RESISTANCE LINES FOR CURRENT CHART TIMEFRAME ==
// Use a function to define the lines
// f_line(x1, y1, y2, _color) =>
//     var line id = na
//     line.delete(id)
//     id := line.new(x1, y1, time, y2, xloc.bar_time, extend.right, _color)

// highLine = f_line(timeSinceHigh, highLevel, highLevel, currentColorR)
// lowLine = f_line(timeSinceLow, lowLevel, lowLevel, currentColorS)


// == ADR TABLE ==
tablePos = tableLocation == "Top" ? position.top_right : position.bottom_right
var table adrTable = table.new(tablePos, 2, 1, border_width = 3)
lightTransp = 90
avgTransp   = 80
heavyTransp = 70
posColor = color.rgb(38, 166, 154)
negColor = color.rgb(240, 83, 80)
volColor = color.new(#999999, 0)

f_fillCellVol(_table, _column, _row, _value) =>
    _transp = abs(_value) > 7 ? heavyTransp : abs(_value) > 4 ? avgTransp : lightTransp
    _cellText = tostring(_value, "0.00") + "%\n" + "ADR"
    table.cell(_table, _column, _row, _cellText, bgcolor = color.new(volColor, _transp), text_color = volColor, width = 6)

srDistance = (highLevel - lowLevel)/highLevel * 100

f_fillCellCalc(_table, _column, _row, _value) =>
    _c_color = _value >= adrCompare ? negColor : posColor
    _transp = _value >= adrCompare*0.8 and _value <= adrCompare*1.2 ? lightTransp : 
      _value >= adrCompare*0.5 and _value < adrCompare*0.8 ? avgTransp :
      _value < adrCompare*0.5 ? heavyTransp :
      _value > adrCompare*1.2 and _value <= adrCompare*1.5 ? avgTransp :
      _value > adrCompare*1.5 ? heavyTransp : na
    _cellText = tostring(_value, "0.00") + "%\n" + "Range"
    table.cell(_table, _column, _row, _cellText, bgcolor = color.new(_c_color, _transp), text_color = _c_color, width = 6)

if barstate.islast
    f_fillCellVol(adrTable, 0, 0, adrValue)
    f_fillCellCalc(adrTable, 1, 0, srDistance)
    // f_fillCellVol(adrTable, 0, 0, inPositionBars)
    // f_fillCellCalc(adrTable, 1, 0, maCrossBars)

// == STRATEGY ENTRY AND EXIT ==
strategy.entry("Buy", strategy.long, stop = buyLevel, when = buyConditions)

stop = stopLevel > trailStopLevel ? stopLevel : close[1] > trailStopLevel and close[1] > trailMa ? trailStopLevel : stopLevel
strategy.exit("Sell", from_entry = "Buy", stop=stop)