Chiến lược phục hồi từ đáy đảo chiều

[trans]
Tổng quan
Chiến lược phục hồi từ đáy là một chiến lược giao dịch cổ phiếu đơn giản và hiệu quả. Nó nắm bắt cơ hội phục hồi từ điểm thấp, tham gia thị trường khi giá cổ phiếu đảo chiều tăng, thực hiện giao dịch ngắn hạn, chốt lời nhanh và cắt lỗ sau khi có lợi nhuận.
Nguyên lý chiến lược
Chiến lược này chủ yếu dựa trên hai chỉ báo: giá thấp nhất 5 ngày để xác định thời điểm vào lệnh và RSI 2 ngày để xác định thời điểm thoát lệnh.
Quy trình cụ thể như sau:
-
Nếu giá đóng cửa hôm nay thấp hơn giá thấp nhất 5 ngày của hôm qua, thì vào lệnh mua tại thời điểm đóng cửa.
-
Nếu RSI 2 ngày đóng cửa trên vùng quá mua (mặc định là 50), thì đóng vị thế mua tại thời điểm đóng cửa để chốt lời.
-
Nếu sau khi vào lệnh 5 ngày mà không kích hoạt điều kiện chốt lời, thì ép buộc cắt lỗ thoát lệnh.
Như vậy, chúng ta vào lệnh mua gần điểm mấu chốt khi giá cổ phiếu đảo chiều tăng, sử dụng tín hiệu quá mua của RSI để khóa lợi nhuận, đồng thời thiết lập giới hạn thời gian cắt lỗ để kiểm soát rủi ro.
Phân tích ưu điểm
Chiến lược này có những ưu điểm sau:
-
Thao tác đơn giản, dễ thực hiện. Chỉ cần quan sát hai chỉ báo, quy tắc rõ ràng, có thể đưa ra quyết định giao dịch nhanh chóng.
-
Sử dụng ý tưởng đảo chiều xu hướng, vào lệnh trước khi giá cổ phiếu đảo chiều tăng, bắt được biến động lớn.
-
Thiết lập điểm chốt lời và cắt lỗ, có thể kiểm soát tổn thất từng lần, đạt được lợi nhuận ổn định.
-
Vòng quay vốn nhanh, không cần chờ đợi lâu, có thể thực hiện nhiều giao dịch lặp lại.
-
Có thể áp dụng rộng rãi cho hầu hết các cổ phiếu, đặc biệt là những cổ phiếu có đặc điểm đảo chiều từ đáy ngắn hạn rõ rệt.
Phân tích rủi ro
Chiến lược này cũng tồn tại một số rủi ro:
-
Chọn sai thời điểm đảo chiều có thể dẫn đến thua lỗ. Việc xác định thời điểm đảo chiều cần kinh nghiệm thực tế.
-
Cài đặt điểm cắt lỗ không phù hợp có thể làm tăng tổn thất. Cần xem xét biên độ cắt lỗ hợp lý.
-
Thị trường dao động, điểm chốt lời khó kích hoạt. Có thể điều chỉnh tham số RSI phù hợp.
-
Chỉ phù hợp giao dịch ngắn hạn, không thích hợp nắm giữ dài hạn.
-
Tần suất giao dịch cao làm tăng chi phí giao dịch và chi phí trượt giá.
Hướng tối ưu hóa
Có thể tối ưu hóa chiến lược này từ các khía cạnh sau:
-
Kết hợp chỉ báo xu hướng, tránh giao dịch ngược chiều. Ví dụ MACD, KDJ, v.v.
-
Kiểm tra tham số số ngày giá thấp nhất khác nhau để tìm chỉ báo xác nhận đảo chiều phù hợp hơn.
-
Kiểm tra kích thước tham số RSI để tối ưu điều kiện chốt lời.
-
Cân nhắc thêm mô-đun tối ưu hóa cắt lỗ, sử dụng ATR để đặt điểm cắt lỗ động.
-
Tối ưu thời điểm vào lệnh, có thể chờ xác nhận đảo chiều rồi mới vào lệnh, lọc các đột phá giả.
-
Sau khi xem xét chi phí giao dịch, đặt mục tiêu chốt lời hợp lý. Kiểm soát tần suất giao dịch.
Kết luận
Chiến lược phục hồi từ đáy là một chiến lược giao dịch ngắn hạn điển hình. Nó nắm bắt cơ hội giao dịch phục hồi từ đáy, sử dụng tổ hợp chỉ báo đơn giản để xác định thời điểm vào và ra lệnh, thực hiện chốt lời và cắt lỗ nhanh chóng. So với chiến lược mua và nắm giữ, chiến lược này có ưu điểm tỷ suất lợi nhuận trên rủi ro cao hơn. Bằng cách liên tục tối ưu hóa tham số và quy tắc, chiến lược này có thể thích ứng với đặc điểm của hầu hết các cổ phiếu, thu được lợi nhuận ổn định. Tuy nhiên, cũng cần cảnh giác với vấn đề chi phí giao dịch do giao dịch quá thường xuyên. Nhìn chung, chiến lược phục hồi từ đáy là một chiến lược giao dịch cổ phiếu vừa đơn giản thực dụng vừa hiệu quả sinh lời.
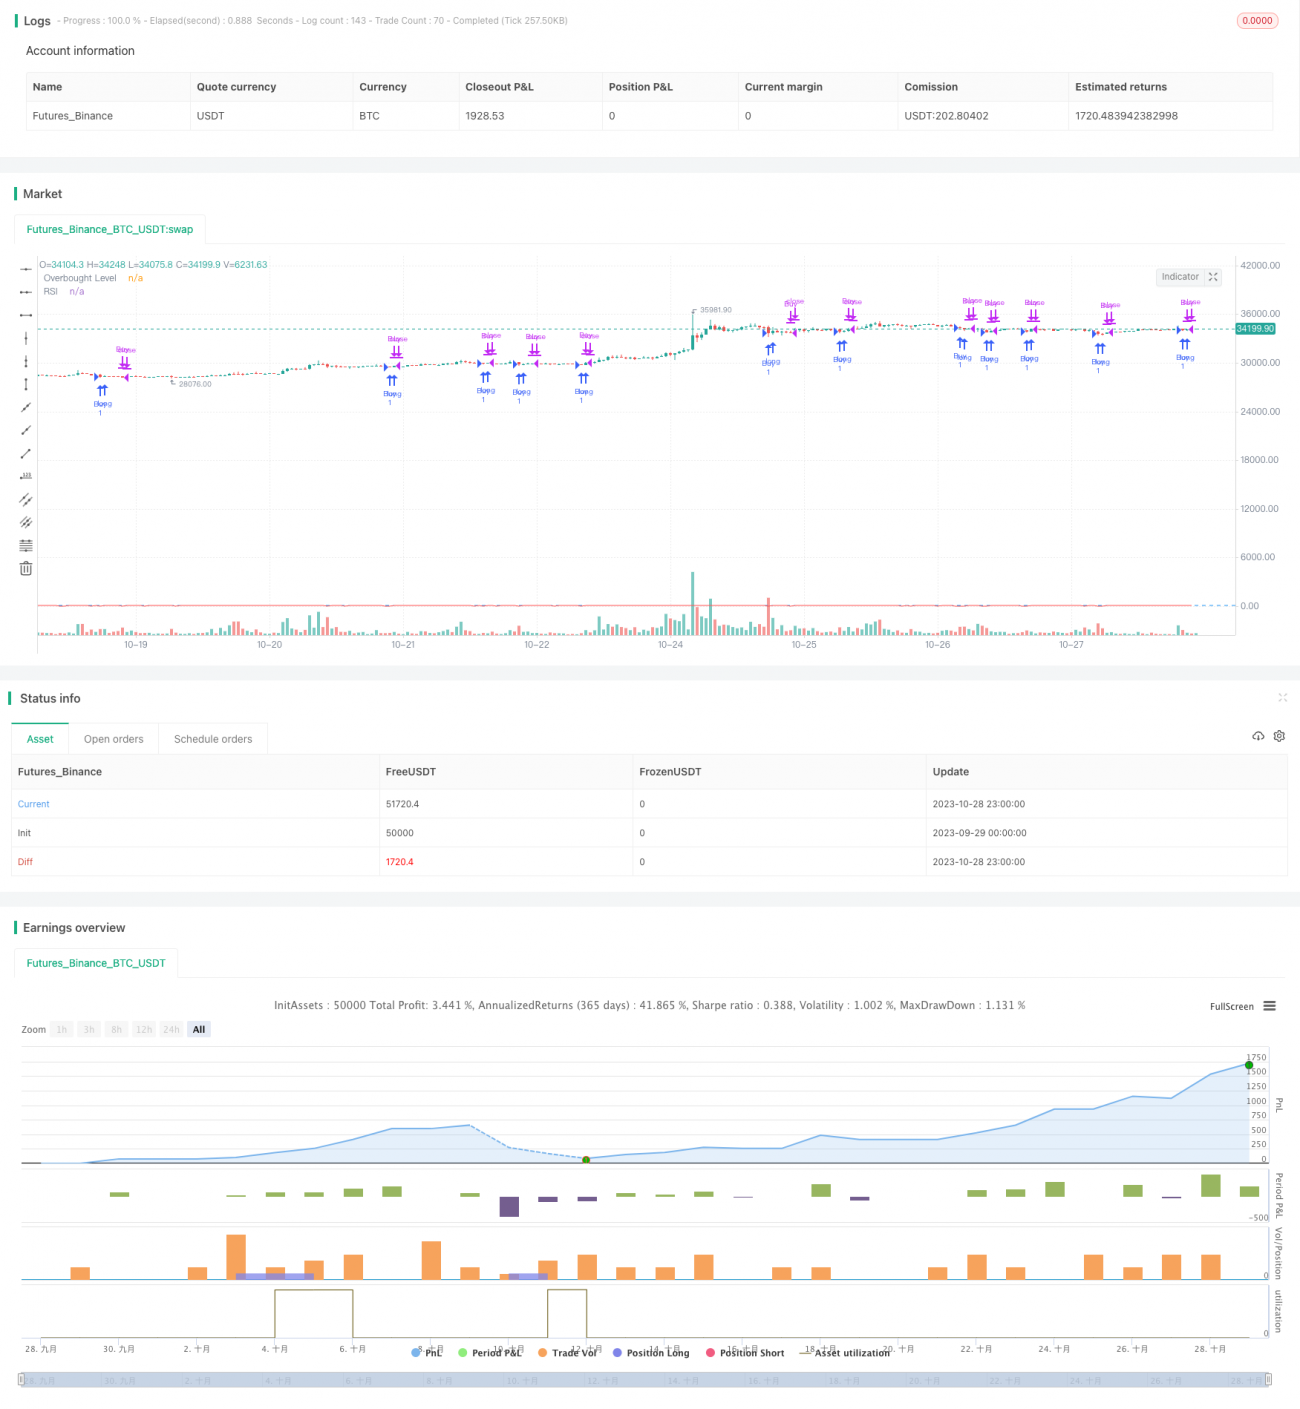
/*backtest
start: 2023-09-29 00:00:00
end: 2023-10-29 00:00:00
period: 1h
basePeriod: 15m
exchanges: [{"eid":"Futures_Binance","currency":"BTC_USDT"}]
*/

// This source code is subject to the terms of the Mozilla Public License 2.0 at https://mozilla.org/MPL/2.0/
// © hobbiecode

// If today’s close is below yesterday’s five-day low, go long at the close.- 1