Chiến lược chu kỳ xu hướng Schaff với đà tăng trưởng theo sau

1
Follow
1779
Followers
Tổng quan
Chiến lược này dựa trên chỉ số chu kỳ xu hướng của Schaff, kết hợp với nguyên tắc mua bán quá mức của Stoch RSI, để xác định và theo dõi xu hướng thông qua chỉ số động lực. Khi giá vượt qua vùng mua bán quá mức, hãy làm nhiều hơn; Khi giá từ vùng mua bán quá mức xuống khu vực bán quá mức, hãy làm trống.
Nguyên tắc chiến lược
-
- Tính MACD, trong đó Fast Length mặc định là 23 và Slow Length mặc định là 50. MACD phản ánh sự khác biệt giữa trung bình di chuyển ngắn hạn và dài hạn, được sử dụng để xác định động lực giá.
-
- MACD được xử lý bởi Stoch RSI để tạo ra giá trị K, trong đó Cycle Length mặc định là 10, phản ánh giá trị mua và bán quá mức của chỉ số động lực MACD.
-
- Đường trung bình di chuyển được trọng lượng đối với giá trị K, tạo ra giá trị D, trong đó 1st % D Length mặc định là 3, loại bỏ tiếng ồn trong giá trị K.
-
- Các giá trị D được xử lý một lần nữa bởi Stoch RSI để tạo ra giá trị STC ban đầu, trong đó giá trị mặc định của 2nd % D Length là 3, tạo ra tín hiệu bán tháo chính xác.
-
- Một trung bình chuyển động được trọng lượng đối với giá trị STC ban đầu, có giá trị STC cuối cùng, trong phạm vi 0-100 ◦ STC cao hơn 75 là vùng mua quá mức, thấp hơn 25 là vùng bán quá mức ◦
-
- Khi STC từ dưới lên vượt qua 25, làm thêm; khi STC từ trên xuống vượt qua 75, làm trống.
Lợi thế chiến lược
-
- Chỉ số STC kết hợp với thiết kế của Stoch RSI, có thể xác định rõ ràng các khu vực quá mua quá bán, tạo thành tín hiệu xu hướng mạnh mẽ hơn.
-
- Thông qua bộ lọc RSI Stoch kép, có thể lọc hiệu quả các đột phá giả.
-
- STC hình thành phạm vi tiêu chuẩn hóa 0-100 có thể tạo ra tín hiệu giao dịch cơ giới.
-
- Phương pháp này có thể hiển thị các dấu hiệu đột phá và cảnh báo pop-up bằng văn bản để nắm bắt cơ hội giao dịch một cách trực quan và rõ ràng.
-
- Chiến lược sử dụng các tham số tối ưu hóa để kiểm soát hiệu quả các giao dịch vô nghĩa và tránh quá nhạy cảm.
Rủi ro chiến lược
-
- Chỉ số STC nhạy cảm với các tham số khác nhau, các đồng tiền khác nhau và thời gian cần điều chỉnh các tham số để phù hợp với các đặc điểm của thị trường.
-
- Chiến lược giao dịch đột phá dễ bị lừa và cần thiết phải đặt lệnh dừng để kiểm soát rủi ro.
-
- Các đột phá giả mạo trong thị trường ít lưu động có thể gây ra tín hiệu sai, cần phải lọc các chỉ số như khối lượng giao dịch tổng hợp.
-
- Chiến lược này chỉ dựa trên chỉ số STC, có thể kết hợp với các yếu tố khác để xác nhận xu hướng và tránh bị dừng lại.
-
- Cần chú ý đến ngưỡng kháng cự hỗ trợ quan trọng để tránh tín hiệu sai trong khu vực.
Hướng tối ưu hóa chiến lược
-
- Tối ưu hóa các tham số của MACD để phù hợp với các chu kỳ và loại tiền tệ khác nhau.
-
- Tối ưu hóa giá trị K và giá trị D của Stoch RSI, làm phẳng đường cong STC.
-
- Kết hợp các chỉ số giao dịch để tránh đột phá giả mạo trong thị trường thiếu thanh khoản.
-
- Thêm các chỉ số khác để xác nhận các tín hiệu xu hướng, chẳng hạn như Blink.
-
- Thêm các cơ chế dừng lỗ, chẳng hạn như dừng di động hoặc dừng ATR.
-
- Điều chỉnh vị trí vào, chẳng hạn như quay trở lại vào sau khi phá vỡ, để đảm bảo xác nhận xu hướng.
Tóm tắt
Chiến lược vòng tròn xu hướng của Schaff xác định khu vực mua quá mức bằng chỉ số động lực và từ đó đánh giá sự thay đổi xu hướng ngắn hạn trong giá. Chiến lược này đơn giản và rõ ràng, có thể điều chỉnh theo các tham số khác nhau của thị trường, nhưng cũng có nguy cơ bị che khuất.
Source
Pine
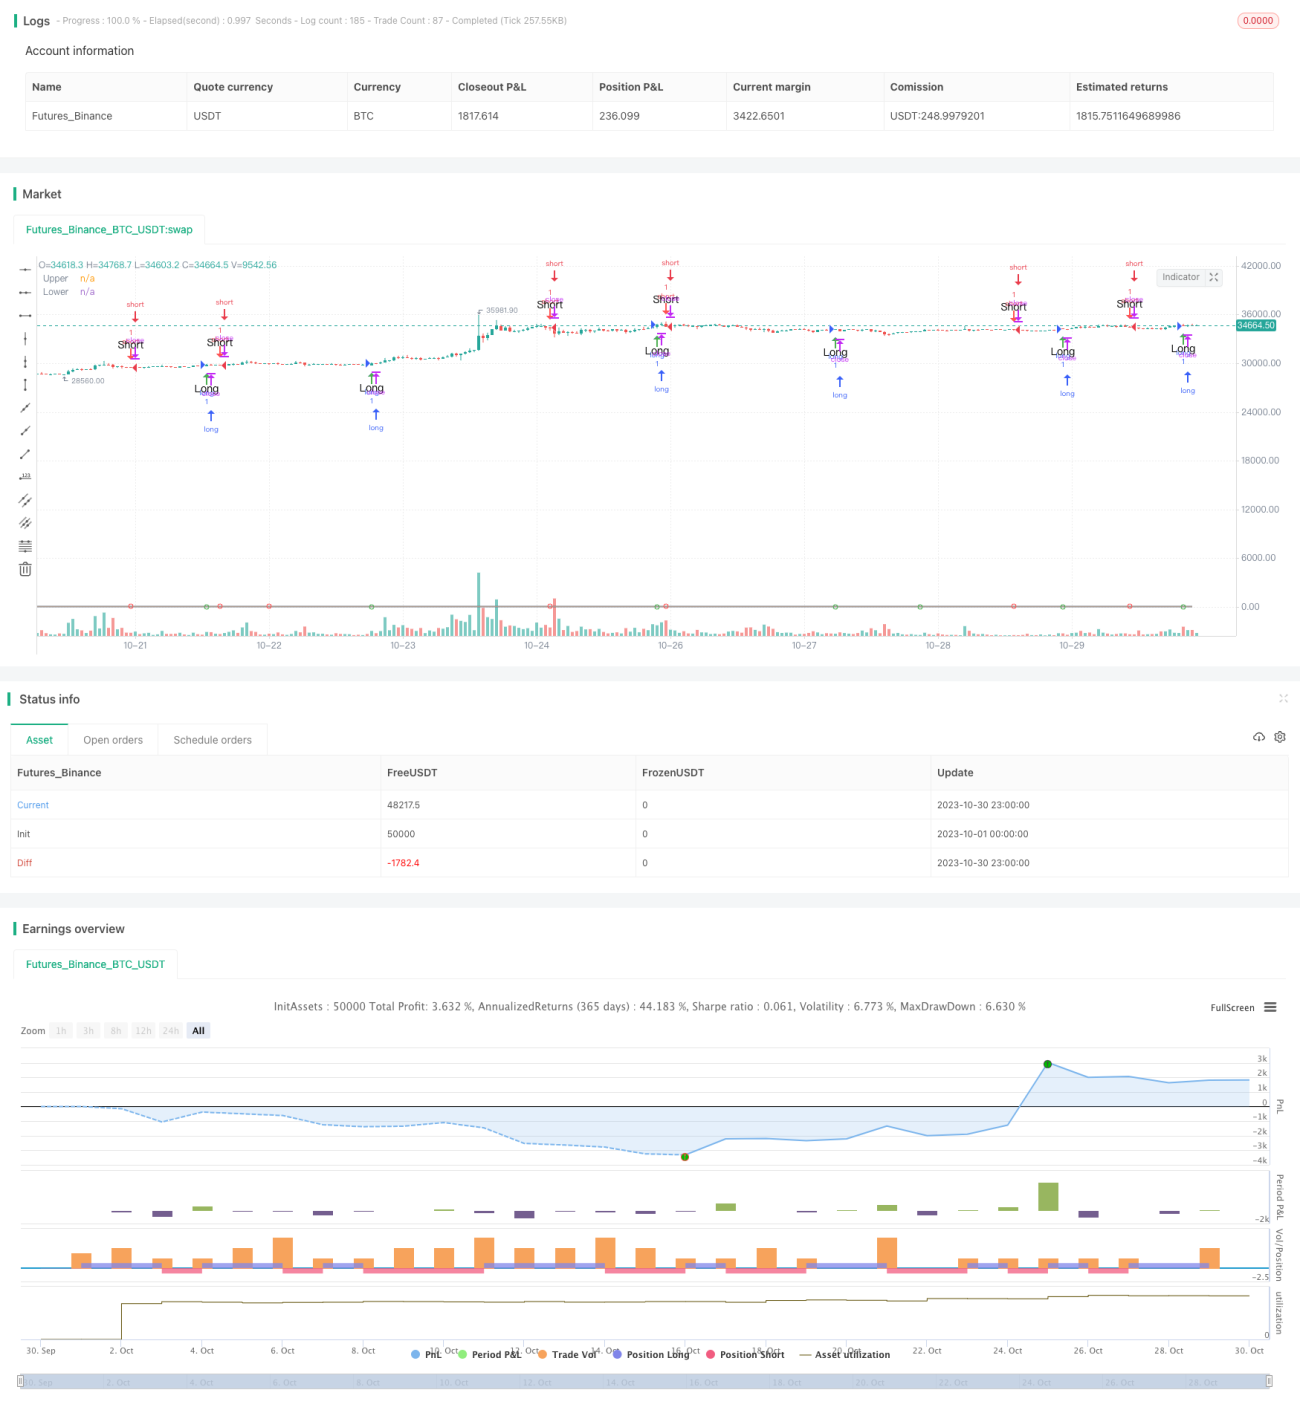
/*backtest
start: 2023-10-01 00:00:00
end: 2023-10-31 00:00:00
period: 1h
basePeriod: 15m
exchanges: [{"eid":"Futures_Binance","currency":"BTC_USDT"}]
*/

//@version=3
// Copyright (c) 2018-present, Alex Orekhov (everget)
// Schaff Trend Cycle script may be freely distributed under the MIT license.
strategy("Schaff Trend Cycle", shorttitle="STC Backtest", overlay=true)Strategy parameters
Related strategies
Comment
All comments (0)
No data
- 1