Chiến lược giao dịch theo đường


Ngày tạo: 2023-11-02 14:14:34 sửa đổi lần cuối: 2023-11-02 14:14:34
sao chép: 0 Số nhấp chuột: 611
1
tập trung vào
1617
Người theo dõi

Chiến lược giao dịch theo đường

Tổng quan

Chiến lược này dựa trên tư tưởng phá vỡ các mức hỗ trợ và kháng cự quan trọng, giao dịch khi giá phá vỡ các đường xu hướng tăng và giảm quan trọng trong biểu đồ giá. Chiến lược này đơn giản, đáng tin cậy và phù hợp với môi trường thị trường có xu hướng rõ ràng.

Nguyên tắc chiến lược

Chiến lược này xác định các điểm quan trọng của giá tăng và giảm bằng cách tính toán các điểm cao và thấp của các đường hình trụ bên trái và bên phải, để có được các đường hỗ trợ và đường áp lực.

  1. sử dụngpivothigh()pivotlow()Chức năng phát hiện các điểm cao và thấp quan trọng.

  2. Phương trình vẽ đường hỗ trợ và đường áp lực dựa trên điểm cao thấp.

  3. Khi giá phá vỡ đường áp lực, làm nhiều hơn; khi giá phá vỡ đường hỗ trợ, làm trống.

  4. Lựa chọn làm nhiều hay ít tùy theo xu hướng.

  5. Bạn có thể chọn chuyển hướng ngay lập tức khi phá vỡ.

  6. Bạn có thể chọn sử dụng Stop Loss, Stop Stop, Trace Loss.

  7. Có thể chọn dừng điểm swing, dừng ATR, dừng cố định.

Chiến lược này có thể phá vỡ giao dịch thông qua các đường dẫn xu hướng đơn giản, kết hợp theo dõi xu hướng và đảo ngược xu hướng, đơn giản và thực tế.

Phân tích lợi thế

  • Chiến lược này đơn giản, dễ hiểu và dễ thực hiện.
  • Có một số lợi thế về xác suất khi sử dụng Breakthrough Theory.
  • Có thể thiết lập Stop Loss Stop và kiểm soát rủi ro.
  • Có thể theo dõi xu hướng hoặc đảo ngược xu hướng.
  • Các tham số có thể tối ưu hóa, áp dụng cho các môi trường thị trường khác nhau.

Phân tích rủi ro

  • Có thể có thông báo sai về tín hiệu đột phá.
  • Thiết lập điểm dừng không đúng cách có thể làm tăng lỗ.
  • Có nguy cơ bị mắc kẹt trong hoạt động đảo ngược.
  • parameter tuning đòi hỏi kinh nghiệm, nếu thiết lập không đúng thì có thể không hiệu quả.
  • Các nhà nghiên cứu cho rằng, các cơn động đất có thể xảy ra trong một thời gian dài, nhưng chúng không thể xảy ra trong một thời gian dài.

Có thể giảm rủi ro bằng cách tối ưu hóa chiến lược dừng lỗ, đánh giá chất lượng tín hiệu đột phá và đánh giá thời gian đảo ngược.

Hướng tối ưu hóa

  • Đánh giá độ tin cậy của tín hiệu đột phá và tăng độ chính xác.
  • Kết hợp với volume, tăng cường tín hiệu đột phá.
  • Tối ưu hóa chiến lược dừng lỗ, thích ứng với biến động thị trường.
  • Đánh giá thời gian tốt nhất để thay đổi.
  • parameter tuning。
  • Đánh giá mô hình đa yếu tố
  • Đánh giá kết hợp với các chỉ số khác.

Tóm tắt

Chiến lược này đơn giản và thực tế, có thể kiểm soát rủi ro để nắm bắt xu hướng giá bằng cách phá vỡ xu hướng đơn giản. Chiến lược này có thể được tối ưu hóa theo nhiều khía cạnh, áp dụng cho nhiều tình huống thị trường hơn, và nói chung là một chiến lược theo dõi xu hướng rất thực tế.
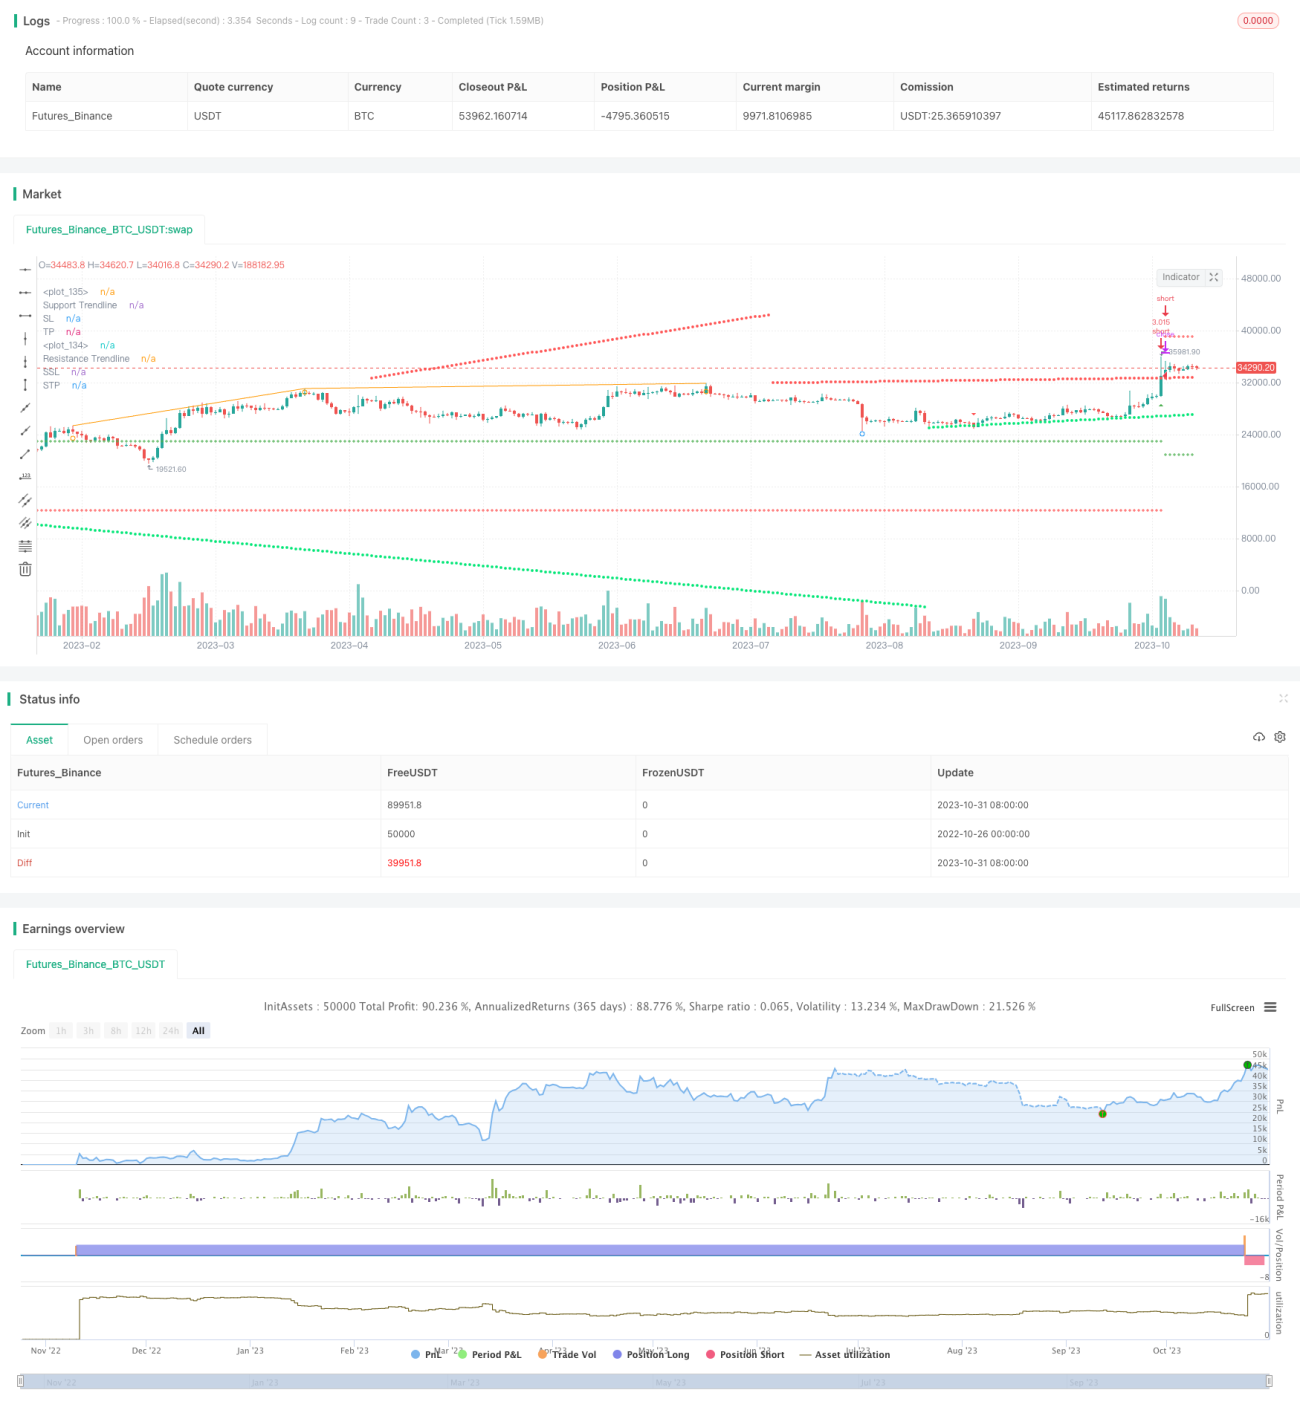
Mã nguồn chiến lược
/*backtest
start: 2022-10-26 00:00:00
end: 2023-11-01 00:00:00
period: 1d
basePeriod: 1h
exchanges: [{"eid":"Futures_Binance","currency":"BTC_USDT"}]
*/

// This source code is subject to the terms of the Mozilla Public License 2.0 at https://mozilla.org/MPL/2.0/
// © tweakerID and © BacktestRookies

// Using the clever calculations and code by BacktestRookies, here is a strategy that buys 
// when the price breaks above a trendline and sells (or shorts) when it crosses below. 
// This logic can be reversed, which seems to work better with recent market conditions.

//@version=4
strategy("Trendlines Strategy", 
     overlay=true, 
     default_qty_type=strategy.percent_of_equity, 
     default_qty_value=100, 
     initial_capital=10000, 
     commission_value=0.04, 
     calc_on_every_tick=false, 
     slippage=0)

direction = input(0, title = "Strategy Direction", type=input.integer, minval=-1, maxval=1)
strategy.risk.allow_entry_in(direction == 0 ? strategy.direction.all : 
 (direction < 0 ? strategy.direction.short : strategy.direction.long))

// Bought and Sold Boolean Signal
bought = strategy.position_size > strategy.position_size[1] 
 or strategy.position_size < strategy.position_size[1]

/////////////////////// STRATEGY INPUTS ////////////////////////////////////////
title1=input(true, "-----------------Strategy Inputs-------------------")  

leftbars = input(100, minval=1, title='Pivot Detection: Left Bars')
rightbars = input(15, minval=1, title='Pivot Detection: Right Bars')
plotpivots = input(true, title='Plot Pivots')

/////////////////////// BACKTESTER /////////////////////////////////////////////
title2=input(true, "-----------------General Inputs-------------------")  

// Backtester General Inputs
i_SL=input(true, title="Use Stop Loss and Take Profit")
TS=input(false, title="Use Trailing Stop")
i_SLType=input(defval="ATR Stop", title="Type Of Stop", options=["Strategy Stop", "Swing Lo/Hi", "ATR Stop"])
i_SPL=input(defval=10, title="Swing Point Lookback")
i_PercIncrement=input(defval=3, step=.1, title="Swing Point SL Perc Increment")*0.01
i_ATR = input(14, title="ATR Length")
i_ATRMult = input(4, step=.1, title="ATR Multiple")
i_TPRRR = input(2, step=.1, title="Take Profit Risk Reward Ratio")
DPR=input(true, "Allow Direct Position Reverse")
reverse=input(true, "Reverse Trades")

// Swing Points Stop and Take Profit
SwingStopProfit() =>
    LL=(lowest(i_SPL))*(1-i_PercIncrement)
    HH=(highest(i_SPL))*(1+i_PercIncrement)
    LL_price = valuewhen(bought, LL, 0)
    HH_price = valuewhen(bought, HH, 0)
    entry_LL_price = strategy.position_size > 0 ? LL_price : na 
    entry_HH_price = strategy.position_size < 0 ? HH_price : na 
    tp=strategy.position_avg_price + (strategy.position_avg_price - entry_LL_price)*i_TPRRR
    stp=strategy.position_avg_price - (entry_HH_price - strategy.position_avg_price)*i_TPRRR
    [entry_LL_price, entry_HH_price, tp, stp]

// ATR Stop
ATRStop() =>
    ATR=atr(i_ATR)*i_ATRMult
    ATRLong = ohlc4 - ATR
    ATRShort = ohlc4 + ATR
    ATRLongStop = valuewhen(bought, ATRLong, 0)
    ATRShortStop = valuewhen(bought, ATRShort, 0)
    LongSL_ATR_price = strategy.position_size > 0 ? ATRLongStop : na 
    ShortSL_ATR_price = strategy.position_size < 0 ? ATRShortStop : na 
    ATRtp=strategy.position_avg_price + (strategy.position_avg_price - LongSL_ATR_price)*i_TPRRR
    ATRstp=strategy.position_avg_price - (ShortSL_ATR_price - strategy.position_avg_price)*i_TPRRR
    [LongSL_ATR_price, ShortSL_ATR_price, ATRtp, ATRstp]
    
// Strategy Stop
StrategyStop(bought) =>
    float LongStop = na
    float ShortStop = na
    float StratTP = na
    float StratSTP = na
    [LongStop, ShortStop, StratTP, StratSTP]

//TrailingStop
TrailingStop(SL,SSL) =>
    dif=(valuewhen(strategy.position_size>0 and strategy.position_size[1]<=0, high,0))
     -strategy.position_avg_price
    trailOffset     = strategy.position_avg_price - SL
    var tstop = float(na)
    if strategy.position_size > 0
        tstop := high- trailOffset - dif
        if tstop<tstop[1]
            tstop:=tstop[1]
    else
        tstop := na
    StrailOffset     = SSL - strategy.position_avg_price
    var Ststop = float(na)
    Sdif=strategy.position_avg_price-(valuewhen(strategy.position_size<0 
     and strategy.position_size[1]>=0, low,0))
    if strategy.position_size < 0
        Ststop := low+ StrailOffset + Sdif
        if Ststop>Ststop[1]
            Ststop:=Ststop[1]
    else
        Ststop := na
    [tstop, Ststop]
  
//Stop Loss & Take Profit Switches  
SLTPLogic(LongStop, ShortStop, StratTP, StratSTP, LongSL_ATR_price, ShortSL_ATR_price, ATRtp, ATRstp,
 entry_LL_price, entry_HH_price, tp, stp) =>
    SL= i_SLType == "Swing Lo/Hi" ? entry_LL_price : i_SLType == "ATR Stop" ? LongSL_ATR_price : LongStop
    SSL= i_SLType == "Swing Lo/Hi" ? entry_HH_price : i_SLType == "ATR Stop" ? ShortSL_ATR_price : ShortStop
    TP= i_SLType == "Swing Lo/Hi" ? tp : i_SLType == "ATR Stop" ? ATRtp : StratTP
    STP= i_SLType == "Swing Lo/Hi" ? stp : i_SLType == "ATR Stop" ? ATRstp : StratSTP
    [SL, SSL, TP, STP]


/////////////////////// STRATEGY LOGIC /////////////////////////////////////////

// Pivots
ph = pivothigh(high, leftbars, rightbars)
pl = pivotlow(low, leftbars, rightbars)

phv1 = valuewhen(ph, high[rightbars], 0)
phb1 = valuewhen(ph, bar_index[rightbars], 0)
phv2 = valuewhen(ph, high[rightbars], 1)
phb2 = valuewhen(ph, bar_index[rightbars], 1)

plv1 = valuewhen(pl, low[rightbars], 0)
plb1 = valuewhen(pl, bar_index[rightbars], 0)
plv2 = valuewhen(pl, low[rightbars], 1)
plb2 = valuewhen(pl, bar_index[rightbars], 1)
    
plotshape(ph, style=shape.circle, location=location.abovebar, color=color.orange,  title='Pivot High', offset=-rightbars)
plotshape(pl, style=shape.circle,   location=location.belowbar, color=color.blue, title='Pivot Low',  offset=-rightbars)

plot(ph ? high[rightbars] : na, color=color.orange, offset=-rightbars)
plot(pl ? low[rightbars] : na, color=color.purple, offset=-rightbars)

// TRENDLINE CODE
// --------------
get_slope(x1,x2,y1,y2)=>
    m = (y2-y1)/(x2-x1)
 
get_y_intercept(m, x1, y1)=>
    b=y1-m*x1

get_y(m, b, ts)=>
    Y = m * ts + b


int   res_x1 = na
float res_y1 = na
int   res_x2 = na
float res_y2 = na

int   sup_x1 = na
float sup_y1 = na
int   sup_x2 = na
float sup_y2 = na


// Resistance
res_x1 := ph ? phb1 : res_x1[1]
res_y1 := ph ? phv1 : res_y1[1]
res_x2 := ph ? phb2 : res_x2[1]
res_y2 := ph ? phv2 : res_y2[1]

res_m = get_slope(res_x1,res_x2,res_y1,res_y2)
res_b = get_y_intercept(res_m, res_x1, res_y1)
res_y = get_y(res_m, res_b, bar_index)

// Support
sup_x1 := pl ? plb1 : sup_x1[1]
sup_y1 := pl ? plv1 : sup_y1[1]
sup_x2 := pl ? plb2 : sup_x2[1]
sup_y2 := pl ? plv2 : sup_y2[1]

sup_m = get_slope(sup_x1,sup_x2,sup_y1,sup_y2)
sup_b = get_y_intercept(sup_m, sup_x1, sup_y1)
sup_y = get_y(sup_m, sup_b, bar_index)


// plot(line.get_y2(line1))
plot(res_y, color=color.red, title='Resistance Trendline', linewidth=2, style=plot.style_circles)
plot(sup_y, color=color.lime, title='Support Trendline', linewidth=2, style=plot.style_circles)

// if ph
//     line.new(phb1,phv1, bar_index, res_y, style=line.style_dashed, color=color.blue)
    
// if pl
//     line.new(plb1,plv1, bar_index, sup_y, style=line.style_dashed, color=color.blue)
    
// Breaks
long_break = crossover(close, res_y)
short_break = crossunder(close, sup_y)
plotshape(long_break,  style=shape.triangleup, color=color.green, size=size.tiny, location=location.belowbar, title='Long Break')
plotshape(short_break, style=shape.triangledown, color=color.red, size=size.tiny, location=location.abovebar, title='Short Break')

BUY=long_break
SELL=short_break

/////////////////////// FUNCTION CALLS /////////////////////////////////////////

// Stops and Profits
[entry_LL_price, entry_HH_price, tp, stp] = SwingStopProfit()
[LongSL_ATR_price, ShortSL_ATR_price, ATRtp, ATRstp] = ATRStop()
[LongStop, ShortStop, StratTP, StratSTP] = StrategyStop(bought)
[SL, SSL, TP, STP] = SLTPLogic(LongStop, ShortStop, StratTP, StratSTP, 
 LongSL_ATR_price, ShortSL_ATR_price, ATRtp, ATRstp, entry_LL_price, entry_HH_price, tp, stp)
[tstop, Ststop] = TrailingStop(SL,SSL)

// Entries
if reverse
    if not DPR
        strategy.entry("long", strategy.long, when=SELL and strategy.position_size == 0)
        strategy.entry("short", strategy.short, when=BUY and strategy.position_size == 0)
    else     
        strategy.entry("long", strategy.long, when=SELL)
        strategy.entry("short", strategy.short, when=BUY)
else
    if not DPR 
        strategy.entry("long", strategy.long, when=BUY and strategy.position_size == 0)
        strategy.entry("short", strategy.short, when=SELL and strategy.position_size == 0)
    else
        strategy.entry("long", strategy.long, when=BUY)
        strategy.entry("short", strategy.short, when=SELL)
// Exits
if i_SL
    strategy.exit("TP & SL", "long", limit=TP, stop=TS? tstop : SL)
    strategy.exit("TP & SL", "short", limit=STP, stop=TS? Ststop : SSL)

/////////////////////// PLOTS //////////////////////////////////////////////////

plot(i_SL and strategy.position_size > 0 and not TS ? SL : i_SL and 
 strategy.position_size > 0 and TS ? tstop : na , title='SL', style=plot.style_cross, color=color.red)
plot(i_SL and strategy.position_size < 0 and not TS ? SSL : i_SL and 
 strategy.position_size < 0 and TS ? Ststop : na , title='SSL', style=plot.style_cross, color=color.red)
plot(i_SL and strategy.position_size > 0 ? TP : na, title='TP', style=plot.style_cross, color=color.green)
plot(i_SL and strategy.position_size < 0 ? STP : na, title='STP', style=plot.style_cross, color=color.green)

// Draw price action setup arrows
plotshape(BUY ? 1 : na, style=shape.triangleup, location=location.belowbar, 
 color=color.green, title="Bullish Setup", size=size.auto)
plotshape(SELL ? 1 : na, style=shape.triangledown, location=location.abovebar, 
 color=color.red, title="Bearish Setup", size=size.auto)