Chiến lược giao dịch định lượng RSI kép

Tổng quan
Chiến lược này sử dụng chỉ số RSI kép để giao dịch hai chiều dài và ngắn, đồng thời kết hợp với hệ thống thống định hướng xu hướng, thuộc chiến lược định lượng RSI kép. Chiến lược đầu tiên sử dụng chỉ số RSI để xác định tín hiệu dư thừa, sau đó kết hợp với định hướng xu hướng định hướng để quyết định làm nhiều nhượng bộ, thuộc chiến lược theo dõi xu hướng điển hình.
Phân tích nguyên tắc
Chiến lược định lượng RSI kép chủ yếu sử dụng chỉ số RSI hai chu kỳ thời gian để xác định tín hiệu giao dịch. Chiến lược này trước tiên đặt hai tham số RSI, một chu kỳ dài làm phán quyết giao dịch chính, một chu kỳ ngắn làm bộ lọc phụ.
Để lọc các tín hiệu giả mạo, chiến lược cũng giới thiệu SMA và EMA trung bình để phán đoán xu hướng. Chỉ khi đường SMA ngắn hạn vượt qua đường EMA dài hạn, hãy xem xét RSI để thực hiện nhiều tín hiệu và chỉ khi đường SMA ngắn hạn vượt qua đường EMA dài hạn, hãy xem xét tín hiệu RSI để làm trống, đảm bảo tín hiệu RSI kép phù hợp với hướng xu hướng và tránh giao dịch ngược xu hướng.
Ngoài ra, chiến lược cũng thiết lập logic dừng lỗ. Sau khi mở vị trí, hai số lệnh dừng khác nhau sẽ được đặt cùng một lúc và thiết lập vị trí dừng lỗ.
Phân tích lợi thế
Chiến lược định lượng RSI kép có những lợi thế sau:
-
Chỉ số RSI hai chu kỳ thời gian có thể xác định chính xác hơn các tín hiệu không gian. Sự kết hợp chéo của RSI chu kỳ dài và ngắn có thể lọc một số tín hiệu giả, cải thiện chất lượng tín hiệu.
-
Hệ thống đường trung bình hỗ trợ xác định hướng của xu hướng lớn, tránh giao dịch ngược xu hướng, có thể lọc hầu hết các giao dịch ồn ào và tăng tỷ lệ thắng.
-
Cơ chế dừng lỗ linh hoạt, có thể đạt được lợi nhuận cao hơn thông qua các thiết lập dừng khác nhau, cũng có thể dừng lỗ để kiểm soát rủi ro.
-
Chiến lược giao dịch logic đơn giản và rõ ràng, dễ hiểu và tối ưu hóa, phù hợp với học tập của nhà giao dịch định lượng.
Phân tích rủi ro
Mặc dù chiến lược định lượng RSI đôi có một số lợi thế, nhưng cũng có những rủi ro sau:
-
Chỉ số RSI tự nó không có hiệu quả trong việc đánh giá tình hình biến động và xu hướng đảo ngược, chiến lược có thể không hiệu quả trong giao dịch trên các thị trường này.
-
Mặc dù hệ thống trung tuyến có thể lọc tiếng ồn trong phạm vi nhỏ, nhưng nó không có hiệu quả trong việc đánh giá sự thay đổi xu hướng trong chu kỳ trung gian và có thể bỏ lỡ điểm chuyển hướng.
-
Cài đặt dừng lỗ không đúng có thể dẫn đến dừng lỗ quá rộng hoặc dừng lỗ quá nhỏ, làm giảm hiệu quả của chiến lược.
-
Doanh số giảm giá lớn có thể dẫn đến tổn thất lớn, cần kiểm soát quy mô vị trí.
Đối với các rủi ro trên, bạn có thể làm giảm rủi ro bằng cách điều chỉnh các tham số RSI, giới thiệu các chỉ số xu hướng và đảo ngược tiên tiến hơn, tối ưu hóa logic dừng lỗ và kiểm soát vị trí.
Hướng tối ưu hóa
Chiến lược định lượng RSI đôi có thể được tối ưu hóa hơn nữa theo một số hướng sau:
-
Thử các kết hợp khác nhau, tối ưu hóa các tham số chu kỳ RSI và tìm ra kết hợp tốt nhất cho các chỉ số RSI dài hoặc ngắn.
-
Kiểm tra các chỉ số đường trung bình khác nhau, giới thiệu các chỉ số như MACD để đánh giá xu hướng và cơ hội đảo ngược.
-
Tối ưu hóa chiến lược dừng lỗ, thiết lập theo dõi dừng lỗ hoặc di chuyển dừng lỗ, cho phép dừng lỗ linh hoạt hơn.
-
Thêm mô-đun kiểm soát vị trí, kiểm soát nhiều vị trí nhược điểm ở các giai đoạn khác nhau của xu hướng chu kỳ lớn.
-
Thêm mô hình học máy nâng cao độ chính xác của các mục nhập và lối ra.
-
Các nhà đầu tư cũng có thể sử dụng các giao dịch này để tìm kiếm các loại giao dịch và chu kỳ thời gian tốt nhất.
Tóm tắt
Chiến lược định lượng RSI kép là một chiến lược theo dõi xu hướng điển hình. Nó kết hợp các chỉ số RSI kép để đánh giá tín hiệu giao dịch và hệ thống lọc tiếng ồn đồng tuyến rất cổ điển và thực tế. Mặc dù chiến lược cũng có một số không gian cải tiến, nhưng logic hoạt động tổng thể rõ ràng, dễ hiểu và tối ưu hóa. Đây là một chiến lược rất phù hợp để học tập và thực hành của người mới bắt đầu giao dịch định lượng.
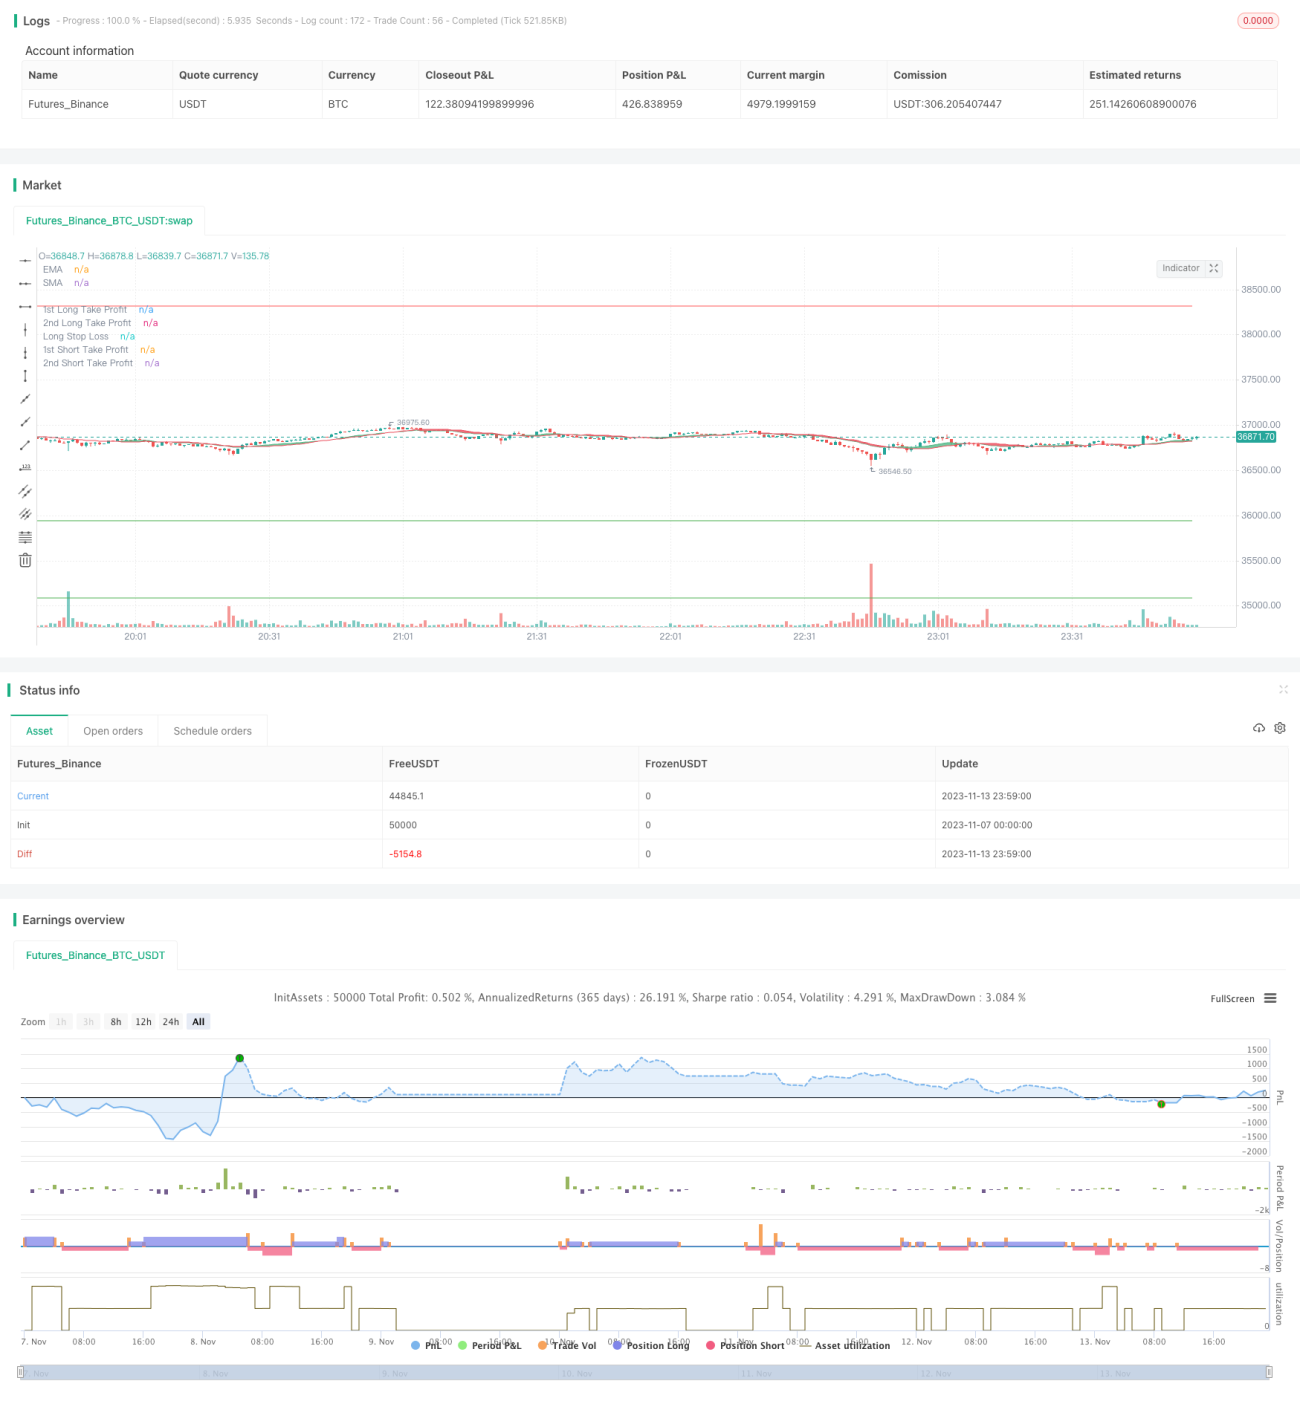
/*backtest
start: 2023-11-07 00:00:00
end: 2023-11-14 00:00:00
period: 1m
basePeriod: 1m
exchanges: [{"eid":"Futures_Binance","currency":"BTC_USDT"}]
*/

//@version=4
strategy("Growth Producer", overlay=true, initial_capital = 1000, currency = "USD", pyramiding = 2, commission_type=strategy.commission.percent, commission_value=0.07, default_qty_type = strategy.percent_of_equity, default_qty_value = 100)

//Functions- 1