Chiến lược dừng lỗ theo dõi xu hướng mạnh gấp đôi

Tác giả:ChaoZhang, Ngày: 2023-11-16 15:50:54
Tags:

img

Tổng quan

Chiến lược này được thiết kế với các cơ chế theo dõi xu hướng kép dựa trên Supertrend và Chỉ số sức mạnh tương đối để xác định chính xác xu hướng của thị trường và thiết lập điểm dừng lỗ và lấy lợi nhuận hợp lý. Chiến lược có các điểm dừng lỗ theo dõi chuyển động của thị trường, lấy lợi nhuận dựa trên xu hướng và phán đoán xu hướng kép, có thể kiểm soát hiệu quả rủi ro của các giao dịch cá nhân và đạt được lợi nhuận siêu mạnh trong các thị trường xu hướng.

Chiến lược logic

  1. Tính toán Supertrend để xác định hướng xu hướng chính. Supertrend có thể đánh giá chính xác hướng xu hướng và đưa ra các điểm nhập lý tưởng.

  2. Tính toán chỉ số sức mạnh tương đối (RSI) như một chỉ số phụ trợ để đánh giá xu hướng. RSI cao cho thấy xu hướng tăng trong thị trường bò. RSI thấp cho thấy xu hướng giảm trong thị trường gấu.

  3. Đi dài khi giá đóng vượt qua đường Supertrend, và đi ngắn khi giá đóng phá vỡ dưới đường Supertrend.

  4. Đặt điểm dừng lỗ và lấy lợi nhuận hợp lý. Khi đi dài, hãy đặt đường Supertrend là mức dừng lỗ, và đường Supertrend cộng với lợi nhuận hợp lý là mức lấy lợi nhuận. Khi đi ngắn, hãy đặt đường Supertrend là mức dừng lỗ, và đường Supertrend trừ lợi nhuận hợp lý là mức lấy lợi nhuận.

  5. Các điểm dừng lỗ sẽ nổi theo biến động của thị trường. Khi thị trường di chuyển theo hướng thuận lợi, đường dừng lỗ sẽ di chuyển theo hướng thuận lợi để đảm bảo lợi nhuận.

  6. Chỉ tham gia giao dịch khi chỉ số RSI phù hợp với Supertrend, cho thấy xu hướng hiện tại mạnh hơn. Tránh tham gia khi chỉ số RSI khác với Supertrend, cho thấy một sự đảo ngược xu hướng tiềm năng.

Phân tích lợi thế

  • Cơ chế đánh giá xu hướng kép có thể giảm các tín hiệu sai và tăng tính ổn định của chiến lược.

  • Các điểm dừng lỗ di chuyển theo xu hướng để tối đa hóa việc khóa lợi nhuận và tránh dừng lỗ sớm.

  • Việc áp dụng chỉ số RSI lọc ra một số tín hiệu giao dịch yếu.

  • Định vị lợi nhuận hợp lý tối đa hóa lợi nhuận.

  • Các thông số chiến lược có thể điều chỉnh có thể được tối ưu hóa cho các sản phẩm và điều kiện thị trường khác nhau.

  • Việc rút tiền có thể kiểm soát được mang lại cho chiến lược khả năng quản lý rủi ro mạnh mẽ.

Phân tích rủi ro

  • Trong trường hợp các sự kiện thiên nga đen như tin tức chính sách quan trọng, những biến động thị trường lớn có thể ngăn chặn các vị trí và gây ra tổn thất lớn.

  • Cài đặt tham số không chính xác có thể dẫn đến điểm dừng lỗ và lấy lợi nhuận không hợp lý, làm tăng lỗ hoặc thu hẹp lợi nhuận.

  • Sự khác biệt giữa chỉ số RSI và siêu xu hướng có thể tạo ra tín hiệu sai trong các thị trường giới hạn phạm vi. Tránh giao dịch và chờ xu hướng rõ ràng trong những trường hợp như vậy.

Hướng dẫn tối ưu hóa

  • Tối ưu hóa tham số thời gian ATR cho các sản phẩm khác nhau.

  • Tối ưu hóa các thiết lập RSI để tìm các điều kiện xu hướng phụ trợ ổn định hơn.

  • Kết hợp các chỉ số khác như Bollinger Bands và KDJ để thiết lập các quy tắc nhập và xuất chính xác hơn.

  • Kiểm tra các chiến lược lợi nhuận khác nhau như dừng lại, dừng lại lợi nhuận, dừng lại để cải thiện lợi nhuận.

  • Điều chỉnh kích thước vị trí dựa trên kết quả backtest để giảm rủi ro giao dịch duy nhất.

Kết luận

Chiến lược này cho thấy sự ổn định và lợi nhuận tổng thể mạnh mẽ. Phán quyết xu hướng kép lọc tiếng ồn hiệu quả và chiến lược dừng lỗ / lợi nhuận khóa lợi nhuận và kiểm soát rủi ro. Tối ưu hóa liên tục các thông số và điều kiện nhập / xuất sẽ cho phép hiệu suất tuyệt vời trong các môi trường thị trường khác nhau.
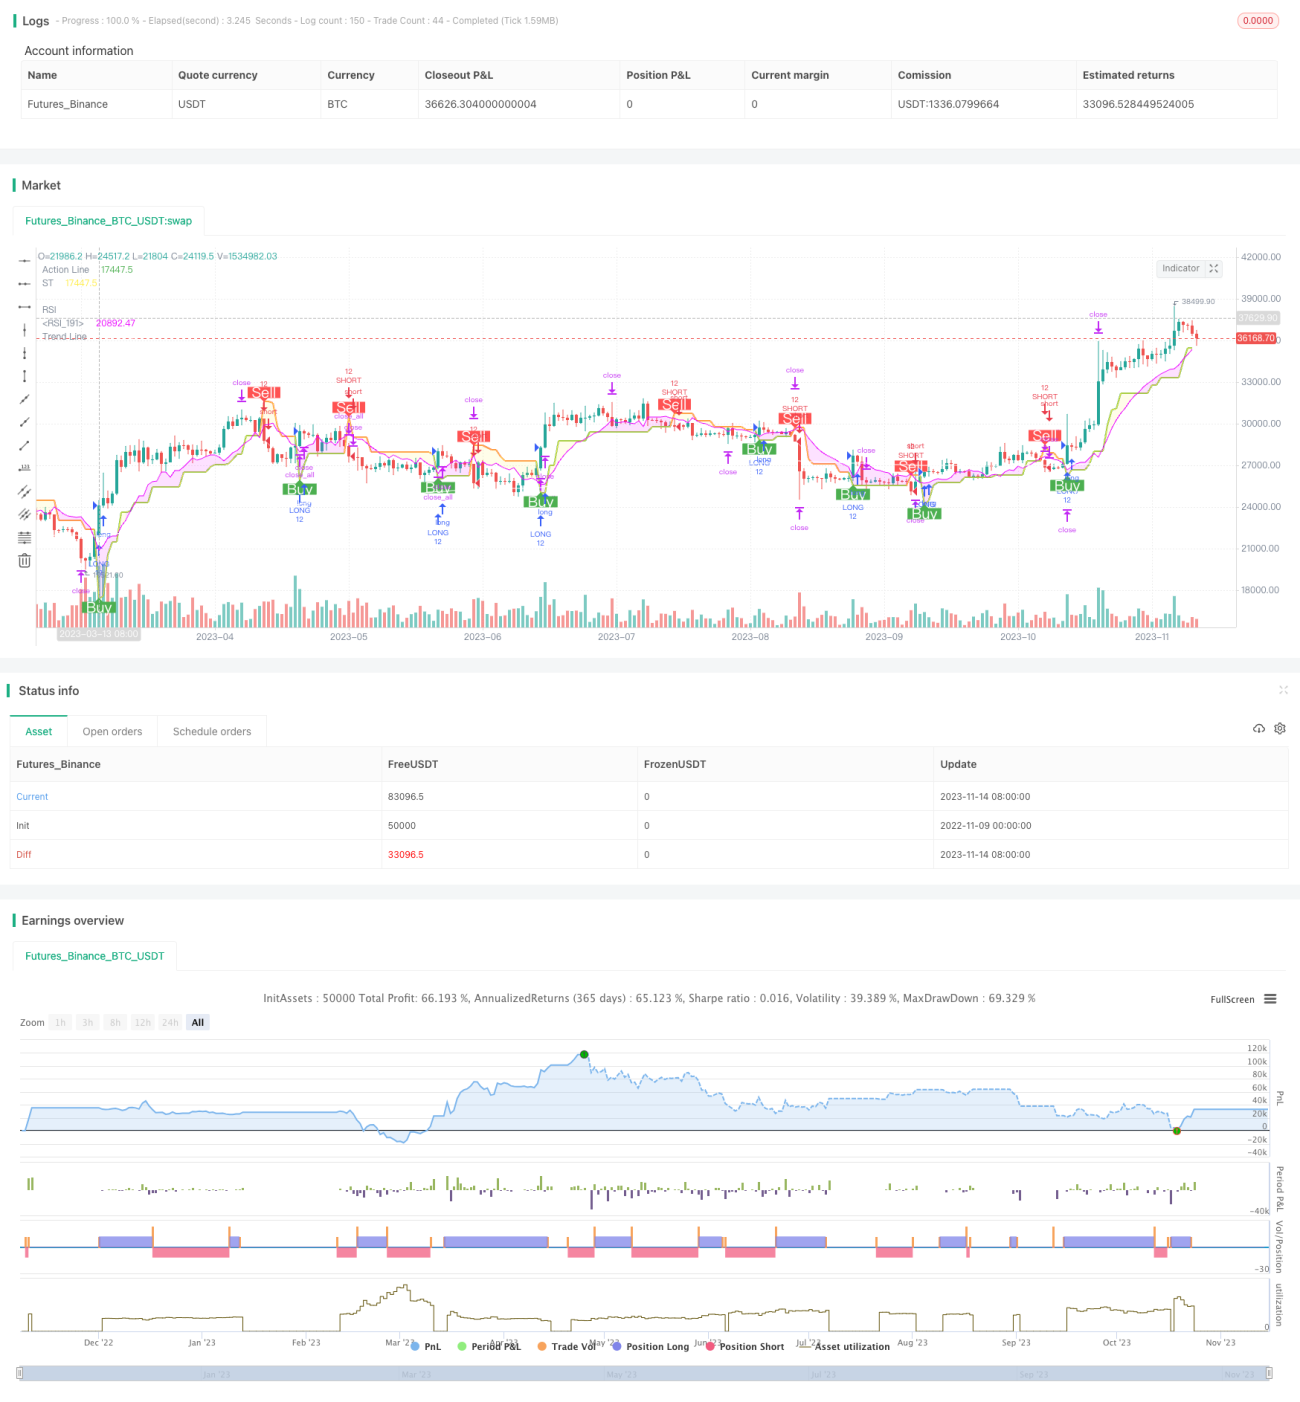
 Nó có thể phục vụ như một chiến lược mẫu tuyệt vời cho giao dịch định lượng và đáng nghiên cứu và áp dụng chuyên sâu.


/*backtest
start: 2022-11-09 00:00:00
end: 2023-11-15 00:00:00
period: 1d
basePeriod: 1h
exchanges: [{"eid":"Futures_Binance","currency":"BTC_USDT"}]
*/

//@version=5
//
// ▒▒▒▒▒▒▒▒▒▒▒▒▒▒▒▒▒▒▒▒▒▒▒▒▒▒▒▒▒▒▒▒▒▒▒▒▒▒▒▒▒▒▒▒▒▒▒▒▒▒▒▒▒▒▒▒▒▒▒▒▒▒▒▒▒▒▒▒▒▒▒▒▒▒▒▒▒▒▒▒▒▒▒▒▒▒▒▒▒▒▒▒▒▒▒▒▒▒▒▒▒▒▒▒▒▒▒▒▒▒▒▒▒▒ 
//  -----------------------------------------------------------------------------
//  Copyright 2019 Mauricio Pimenta | exit490
//  SuperTrend with Trailing Stop Loss script may be freely distributed under the MIT license.
//
//  Permission is hereby granted, free of charge, 
//  to any person obtaining a copy of this software and associated documentation files (the "Software"), 
//  to deal in the Software without restriction, including without limitation the rights to use, copy, modify, merge, 
//  publish, distribute, sublicense, and/or sell copies of the Software, and to permit persons to whom the Software is furnished to do so, 
//  subject to the following conditions:
//
//  The above copyright notice and this permission notice shall be included in all copies or substantial portions of the Software.
//
//  THE SOFTWARE IS PROVIDED "AS IS", WITHOUT WARRANTY OF ANY KIND, 
//  EXPRESS OR IMPLIED, INCLUDING BUT NOT LIMITED TO THE WARRANTIES OF MERCHANTABILITY, 
//  FITNESS FOR A PARTICULAR PURPOSE AND NONINFRINGEMENT. IN NO EVENT SHALL THE AUTHORS OR COPYRIGHT HOLDERS BE LIABLE FOR ANY CLAIM, 
//  DAMAGES OR OTHER LIABILITY, WHETHER IN AN ACTION OF CONTRACT, TORT OR OTHERWISE, ARISING FROM, 
//  OUT OF OR IN CONNECTION WITH THE SOFTWARE OR THE USE OR OTHER DEALINGS IN THE SOFTWARE.
//
//  -----------------------------------------------------------------------------
//
//  Authors:  @exit490
//  Revision: v1.0.0
//  Date:     5-Aug-2019
//
//  Description
//  ===========
//  SuperTrend is a moving stop and reversal line based on the volatility (ATR).
//  The strategy will ride up your stop loss when price moviment 1%.
//  The strategy will close your operation when the market price crossed the stop loss.
//  The strategy will close operation when the line based on the volatility will crossed
//
//  The strategy has the following parameters:
//
//  INITIAL STOP LOSS - Where can isert the value to first stop.
//  POSITION TYPE - Where can to select trade position.
//  ATR PERIOD - To select number of bars back to execute calculation
//  ATR MULTPLIER - To add a multplier factor on volatility
//  BACKTEST PERIOD - To select range.
//  
//  -----------------------------------------------------------------------------
//  Disclaimer:
//    1. I am not licensed financial advisors or broker dealers. I do not tell you 
//       when or what to buy or sell. I developed this software which enables you 
//       execute manual or automated trades multplierFactoriplierFactoriple trades using TradingView. The 
//       software allows you to set the criteria you want for entering and exiting 
//       trades.
//    2. Do not trade with money you cannot afford to lose.
//    3. I do not guarantee consistent profits or that anyone can make money with no 
//       effort. And I am not selling the holy grail.
//    4. Every system can have winning and losing streaks.
//    5. Money management plays a large role in the results of your trading. For 
//       example: lot size, account size, broker leverage, and broker margin call 
//       rules all have an effect on results. Also, your Take Profit and Stop Loss 
//       settings for individual pair trades and for overall account equity have a 
//       major impact on results. If you are new to trading and do not understand 
//       these items, then I recommend you seek education materials to further your
//       knowledge.
//
//    YOU NEED TO FIND AND USE THE TRADING SYSTEM THAT WORKS BEST FOR YOU AND YOUR 
//    TRADING TOLERANCE.
//
//    I HAVE PROVIDED NOTHING MORE THAN A TOOL WITH OPTIONS FOR YOU TO TRADE WITH THIS PROGRAM ON TRADINGVIEW.
//    
//    I accept suggestions to improve the script.
//    If you encounter any problems I will be happy to share with me.
//  -----------------------------------------------------------------------------
//
// ▒▒▒▒▒▒▒▒▒▒▒▒▒▒▒▒▒▒▒▒▒▒▒▒▒▒▒▒▒▒▒▒▒▒▒▒▒▒▒▒▒▒▒▒▒▒▒▒▒▒▒▒▒▒▒▒▒▒▒▒▒▒▒▒▒▒▒▒▒▒▒▒▒▒▒▒▒▒▒▒▒▒▒▒▒▒▒▒▒▒▒▒▒▒▒▒▒▒▒▒▒▒▒▒▒▒▒▒▒▒▒▒▒▒ //

strategy(title='DEO SESSSION', shorttitle='DEO S', overlay=true, precision=8, calc_on_order_fills=true, calc_on_every_tick=true, backtest_fill_limits_assumption=0, default_qty_type=strategy.percent_of_equity, default_qty_value=100, initial_capital=1000, currency=currency.USD, linktoseries=true)

//
// ▒▒▒▒▒▒▒▒▒▒▒▒▒▒▒▒▒▒▒▒▒▒▒▒▒▒▒▒▒▒▒▒▒▒▒▒▒▒▒▒▒▒▒▒▒▒▒▒▒▒▒▒▒▒▒▒▒▒▒▒▒▒▒▒▒▒▒▒▒▒▒▒▒▒▒▒▒▒▒▒▒▒▒▒▒▒▒▒▒▒▒▒▒▒▒▒▒▒▒▒▒▒▒▒▒▒▒▒▒▒▒▒▒▒ //

// === BACKTEST RANGE ===
backTestSectionFrom = input(title='════════════ FROM ════════════', defval=true)


// selected dates 
i_startTime     = input(title="START FILTER", defval=timestamp("02 Jan 2023 00:00 +0000"), group="RISK MANAGEMENT", tooltip="Start date & time to begin searching for setups")
i_endTime       = input(title="END FILTER", defval=timestamp("12 Dec 2100 00:00 +0000"), group="RISK MANAGEMENT", tooltip="End date & time to stop searching for setups")
afterStartDate = true

//
// ▒▒▒▒▒▒▒▒▒▒▒▒▒▒▒▒▒▒▒▒▒▒▒▒▒▒▒▒▒▒▒▒▒▒▒▒▒▒▒▒▒▒▒▒▒▒▒▒▒▒▒▒▒▒▒▒▒▒▒▒▒▒▒▒▒▒▒▒▒▒▒▒▒▒▒▒▒▒▒▒▒▒▒▒▒▒▒▒▒▒▒▒▒▒▒▒▒▒▒▒▒▒▒▒▒▒▒▒▒▒▒▒▒▒ //

parameterSection = input(title='══════════ STRATEGY ══════════', defval=true)
// === INPUT TO SELECT POSITION ===
positionType = input.string(defval='LONG', title='Position Type', options=['LONG', 'SHORT'])

// === INPUT TO SELECT INITIAL STOP LOSS
initialStopLossPercent = input.float(defval=3.0, minval=0.0, title='Initial Stop Loss')

// === INPUT TO SELECT BARS BACK
barsBack = input(title='ATR Period', defval=1)

// === INPUT TO SELECT MULTPLIER FACTOR 
multplierFactor = input.float(title='ATR multplierFactoriplier', step=0.1, defval=3.0)


RSI = input.int(title='RSI', defval=7, minval=1, maxval=100)

calcSection = input(title='══════════ LOT CALC ══════════', defval=true)
accountBalance = input.float(title="ACCOUNT BALANCE", defval=250000, minval=1,  group="INPUTS")
entryPrice = input.float(title="ENTRY PRICE", defval=100, minval=1,  group="INPUTS")
slPrice = input.float(title="STOP LOSS PRICE", defval=100, minval=1,  group="INPUTS")
riskPer = input.float(title="RISK USD", defval=1, minval=0.1,  group="INPUTS")
lotSize = input.float(title="LOT SIZE", defval=10, minval=0.1,  group="INPUTS")

RiskSize = riskPer
qtyLongTargetPrice = math.abs((RiskSize / ((entryPrice - slPrice) * syminfo.pointvalue)) / lotSize)

trendcSection = input(title='══════════ TREND LINE ══════════', defval=true)
// ema trend 
tLen = input.int(200, minval=1, title="Trend Line")
tSrc = input(close, title="Source")
thisEma = ta.ema(tSrc, tLen)
plot(thisEma, title = "Trend Line",color=#ffffff)

MTSection = input(title='══════════ MT LOGIN ══════════', defval=true)
exchange = input.string(defval='MT5', title='EXCHANGE',  options=['MT4', 'MT5'])
mtLogin= input.string(defval="", title='MT LOGIN', group = "mt")
mtPassword =input.string(defval='', title='MT PASSWORD',  group = "mt")
mtServer =input.string(defval='', title='MT SERVER', group = "mt")
mtIsOn = input.string(defval='ON', title='STRATEGY ON', options=['ON', 'OFF'])
mtEntryMode = input.string(defval='CLOSE OPEN', title='ENTRY MODE', options=['CLOSE OPEN', 'OPEN'])

displaySection = input(title='══════════ DISPLAY LOGIN ══════════', defval=true)
displayTable = input(title="DISPLAY TABLE", defval=false, group = 'PRODUCTION', tooltip = "MAKES YOUR STRATEGY TRIGGER SLOWER")


//
// ▒▒▒▒▒▒▒▒▒▒▒▒▒▒▒▒▒▒▒▒▒▒▒▒▒▒▒▒▒▒▒▒▒▒▒▒▒▒▒▒▒▒▒▒▒▒▒▒▒▒▒▒▒▒▒▒▒▒▒▒▒▒▒▒▒▒▒▒▒▒▒▒▒▒▒▒▒▒▒▒▒▒▒▒▒▒▒▒▒▒▒▒▒▒▒▒▒▒▒▒▒▒▒▒▒▒▒▒▒▒▒▒▒▒ //

// LOGIC TO FIND DIRECTION WHEN THERE IS TREND CHANGE ACCORDING VOLATILITY
atr = multplierFactor * ta.atr(barsBack)

longStop = hl2 - atr
longStopPrev = nz(longStop[1], longStop)
longStop := close[1] > longStopPrev ? math.max(longStop, longStopPrev) : longStop

shortStop = hl2 + atr
shortStopPrev = nz(shortStop[1], shortStop)
shortStop := close[1] < shortStopPrev ? math.min(shortStop, shortStopPrev) : shortStop

direction = 1
direction := nz(direction[1], direction)
direction := direction == -1 and close > shortStopPrev ? 1 : direction == 1 and close < longStopPrev ? -1 : direction


longColor = color.blue
shortColor = color.blue

var valueToPlot = 0.0
var colorToPlot = color.white

if direction == 1
    valueToPlot := longStop
    colorToPlot := color.green
    colorToPlot
else
    valueToPlot := shortStop
    colorToPlot := color.red
    colorToPlot

//RSI

src = close

ep = 2 * RSI - 1
auc = ta.ema(math.max(src - src[1], 0), ep)
adc = ta.ema(math.max(src[1] - src, 0), ep)
x1 = (RSI - 1) * (adc * 70 / (100 - 70) - auc)
ub = x1 >= 0 ? src + x1 : src + x1 * (100 - 70) / 70
x2 = (RSI - 1) * (adc * 30 / (100 - 30) - auc)
lb = x2 >= 0 ? src + x2 : src + x2 * (100 - 30) / 30

//Affichage
plot(math.avg(ub, lb), color=color.white ,linewidth=1, title='RSI')
plot(valueToPlot == 0.0 ? na : valueToPlot, title='Action Line', linewidth=2, color=color.new(colorToPlot, 0))
plotshape(direction == 1 and direction[1] == -1 ? longStop : na, title='Buy', style=shape.labelup, location=location.absolute, size=size.normal, text='Buy', textcolor=color.new(color.white, 0), color=color.new(color.green, 0))
plotshape(direction == -1 and direction[1] == 1 ? shortStop : na, title='Sell', style=shape.labeldown, location=location.absolute, size=size.normal, text='Sell', textcolor=color.new(color.white, 0), color=color.new(color.red, 0))


p_ma1 = plot(valueToPlot, title = "ST", color = color.rgb(255, 236, 66))
p_ma2 = plot(math.avg(ub, lb), title = "RSI", color = color.rgb(234, 0, 255))
// Definitions: Trends
TrendUp1() =>
    valueToPlot > math.avg(ub, lb)
TrendDown1() =>
    valueToPlot < math.avg(ub, lb)

trendColor1 = TrendUp1() ? color.rgb(255, 236, 66, 85): TrendDown1() ? color.rgb(234, 0, 255, 85) : color.rgb(255, 255, 255, 85)
fill(p_ma1, p_ma2, color=trendColor1)


longCondition () =>
    ta.crossover(close, valueToPlot)

shortCondition () =>
    ta.crossunder(close, valueToPlot)

IsLongShort() =>
    strategy.position_size != 0

getNewLotSize() => 
    math.abs(riskPer / (close - valueToPlot))

// plot(getNewLotSize(), "new lot size")
newLotS = getNewLotSize()


alertManagement = str.tostring(exchange) + "," + str.tostring(mtLogin) +  "," +str.tostring(mtPassword) + "," 
alertManagement += str.tostring(mtServer) + "," + str.tostring(newLotS)
// alertManagement += str.tostring(stopLoss) + "," + str.tostring(applyingSL) + "," + str.tostring(applyTrailingStop)  + "," 
// alertManagement += str.tostring(exchange) + "," + str.tostring(exchangeAccount) + "," + str.tostring(slAmount)  + "," + str.tostring(closeTpAmount) + "," 
// alertManagement += str.tostring(exchangeLeverage) + "," + str.tostring(exchangeLeverageType) + "," 
// alertManagement += str.tostring(mtLogin) + "," + str.tostring(mtPassword) + "," + str.tostring(mtServer)  + "," + str.tostring(mtLot) + "," 
// alertManagement += str.tostring(mtTp) + "," + str.tostring(mtTs) + "," + str.tostring(orderStrategy) 


// alertManagement = "alertManagement"
myStop = 0.0
myTarget = 0.0

if (longCondition())
    qtyLongTargetPrice := math.abs((RiskSize / ((close - valueToPlot) * syminfo.pointvalue)) / lotSize)
    if IsLongShort()
        strategy.close_all(comment = "close all entries")
    strategy.entry("LONG", strategy.long, qty=12, comment="LONG", alert_message=alertManagement)
    strategy.exit("TPL", "LONG", stop=valueToPlot, limit= close + (close - valueToPlot), comment="Target", alert_message=alertManagement)

if (shortCondition())
    qtyLongTargetPrice := math.abs((RiskSize / ((close - valueToPlot) * syminfo.pointvalue)) / lotSize)
    if IsLongShort()
        strategy.close_all(comment = "close all entries")
    strategy.entry("SHORT", strategy.short, qty=12, comment="SHORT", alert_message=alertManagement)
    strategy.exit("TPS", "SHORT", stop=valueToPlot, limit= close + (close - valueToPlot), comment="Target", alert_message=alertManagement)


// Calculate the average profit per open trade
// avgProfit = profitSum / strategy.opentrades

getTotalProfit()=>
    // Sum the profit of all open trades
    profitSum = 0.0
    for tradeNumber = 0 to strategy.closedtrades - 1
        if strategy.closedtrades.profit(tradeNumber) > 0
            profitSum += strategy.closedtrades.profit(tradeNumber)
    result = profitSum

getTotalLoss()=>
    // Sum the profit of all open trades
    lossSum = 0.0
    for tradeNumber = 0 to strategy.closedtrades - 1
        if strategy.closedtrades.profit(tradeNumber) < 0
            lossSum += strategy.closedtrades.profit(tradeNumber)
    result = lossSum


maxLossRun()=>
    lossRun = 0.0
    currentMaxLoss = 0.0
    for tradeNo = 0 to strategy.closedtrades - 1
        if strategy.closedtrades.profit(tradeNo) < 0.0
            lossRun += strategy.closedtrades.profit(tradeNo)
        else 
            currentMaxLoss := math.min(currentMaxLoss, lossRun)  
            lossRun := 0.0
    result = currentMaxLoss


TotalTrades() =>
	strategy.closedtrades + strategy.opentrades

maxDrawDown() =>
    maxDrawdown = 0.0
    for tradeNo = 0 to strategy.closedtrades - 1
        maxDrawdown := math.max(maxDrawdown, strategy.closedtrades.max_drawdown(tradeNo))
    result = maxDrawdown

maxRunUp() =>
    maxRunup = 0.0
    for tradeNo = 0 to strategy.closedtrades - 1
        maxRunup := math.max(maxRunup, strategy.closedtrades.max_runup(tradeNo))
    result = maxRunup

tradeMaxLossReached() =>
    maxLoss = 0.0
    for tradeNo = 0 to strategy.closedtrades - 1
        maxLoss := math.min(maxLoss, strategy.closedtrades.profit(tradeNo))
    result = maxLoss


tradingStartTime() =>
    strategy.closedtrades.entry_time(0)


daysBetween(t1, t2) => (t1 - t2) / 86400000

// Table
var InfoPanel = table.new(position = position.bottom_right, columns = 2, rows = 40, border_width = 1)
ftable(_table_id, _column, _row, _text, _bgcolor) => 
    table.cell(_table_id, _column, _row, _text, 0, 0, color.black, text.align_right, text.align_center, size.small, _bgcolor)

tfString(int timeInMs) =>
    // @function    Produces a string corresponding to the input time in days, hours, and minutes.
    // @param       (series int) A time value in milliseconds to be converted to a string variable. 
    // @returns     (string) A string variable reflecting the amount of time from the input time.
    float s  = timeInMs / 100000
    float m  = s / 60
    float h  = m / 60
    float d  = h / 24
    float mo = d / 30.416
    int tm   = math.floor(m % 60)
    int tr   = math.floor(h % 24)
    int td   = math.floor(d % 30.416)
    int tmo  = math.floor(mo % 12)
    int ys   = math.floor(d / 365)
    
    string result = 
      switch
        d == 30 and tr == 10 and tm == 30 => "1M"
        d == 7  and tr == 0  and tm == 0  => "1W"
        =>
            string yStr  = ys  ? str.tostring(ys)  + "Y "  : ""
            string moStr = tmo ? str.tostring(tmo) + "M "  : ""
            string dStr  = td  ? str.tostring(td)  + "D "  : ""
            string hStr  = tr  ? str.tostring(tr)  + "H "  : ""
            string mStr  = tm  ? str.tostring(tm)  + "min" : ""
            yStr + moStr + dStr + hStr + mStr


if displayTable
    maxLossRunInMarket= maxLossRun()
    maxLossReached = tradeMaxLossReached()
    tradeMaxLossReached = tradeMaxLossReached()
    tradingInDays=daysBetween(time, tradingStartTime())
    totalTrades=TotalTrades()

Thêm nữa