Chiến lược đảo ngược giao cắt đường trung bình động kép

1
Follow
1779
Followers
Tổng quan
Ý tưởng chính của chiến lược này là sử dụng đường trung bình di chuyển nhanh và đường trung bình di chuyển chậm để đánh giá xu hướng thị trường và tham gia vào khi đường trung bình ngắn và đường trung bình dài bị đảo ngược, để có hiệu quả theo dõi xu hướng.
Nguyên tắc chiến lược
- Cài đặt chu kỳ đường trung bình di chuyển nhanh shortma ((7 ngày mặc định) và chu kỳ đường trung bình di chuyển chậm longma ((77 ngày mặc định)
- Khi đường ngắn đi qua đường dài trên đường trung bình được đánh giá là tín hiệu mua, ghi barssince ((mabuy), đường dài có nghĩa là vào xu hướng; khi đường ngắn đi qua đường dài dưới đường trung bình được đánh giá là tín hiệu bán, ghi barssince ((masell), đường dài có nghĩa là kết thúc xu hướng
- So sánh kích thước của barssince, số bar của đường trung bình ngắn xuyên qua từ trên xuống cho thấy thời gian kéo dài của xu hướng; ngược lại, số hốc của đường trung bình ngắn xuyên qua từ dưới lên cho thấy tín hiệu đảo ngược mạnh hơn
- Tín hiệu mua được phát ra khi số bar của tín hiệu bán lớn hơn số bar của tín hiệu mua; tín hiệu bán được phát ra khi số bar của tín hiệu mua lớn hơn số bar của tín hiệu bán
- such là một chiến lược đảo ngược hai đường trung bình, đánh giá điểm thay đổi xu hướng bằng cách đảo ngược đường trung bình nhanh và đường trung bình chậm
Lợi thế chiến lược
- Sử dụng phán đoán hai chiều bằng nhau, lọc một số tín hiệu giao dịch nhiễu
- Tăng so sánh barssince, tránh các tín hiệu sai dẫn đến phá giá sai và giá đóng
- Dễ hiểu và dễ thực hiện
- Các tham số trung bình di chuyển có thể tùy chỉnh cho các chu kỳ và thị trường khác nhau
Rủi ro chiến lược
- Chiến lược hai đường đồng nhất dễ tạo ra nhiều tín hiệu hơn, giao dịch thường xuyên
- Thiết lập tham số đường trung bình di chuyển không đúng có thể bỏ lỡ cơ hội xu hướng dài hơn
- Khi phá vỡ đường trung bình dài hạn, điểm dừng có thể rất xa và có sự rút lui lớn
- Không thể lọc thành công các biến động và biến động của thị trường
Hướng tối ưu hóa chiến lược
- Thêm bộ lọc cho các chỉ số khác để tránh bị mắc kẹt trong cơn động đất
- Tăng hệ thống chống thiệt hại
- Tối ưu hóa các tham số đường trung bình di chuyển
- Các tham số đường trung bình di chuyển được điều chỉnh theo động lực chu kỳ thị trường
Tóm tắt
Chiến lược nói chung là logic rõ ràng và dễ hiểu, thông qua đường trung bình nhanh và đường trung bình chậm để đánh giá điểm biến đổi xu hướng thị trường, theo lý thuyết có thể theo dõi xu hướng hiệu quả. Tuy nhiên, trong ứng dụng thực tế, vẫn cần tối ưu hóa cho thuật toán chiến lược và cài đặt tham số để làm cho nó ổn định hơn và thực tế.
Source
Pine
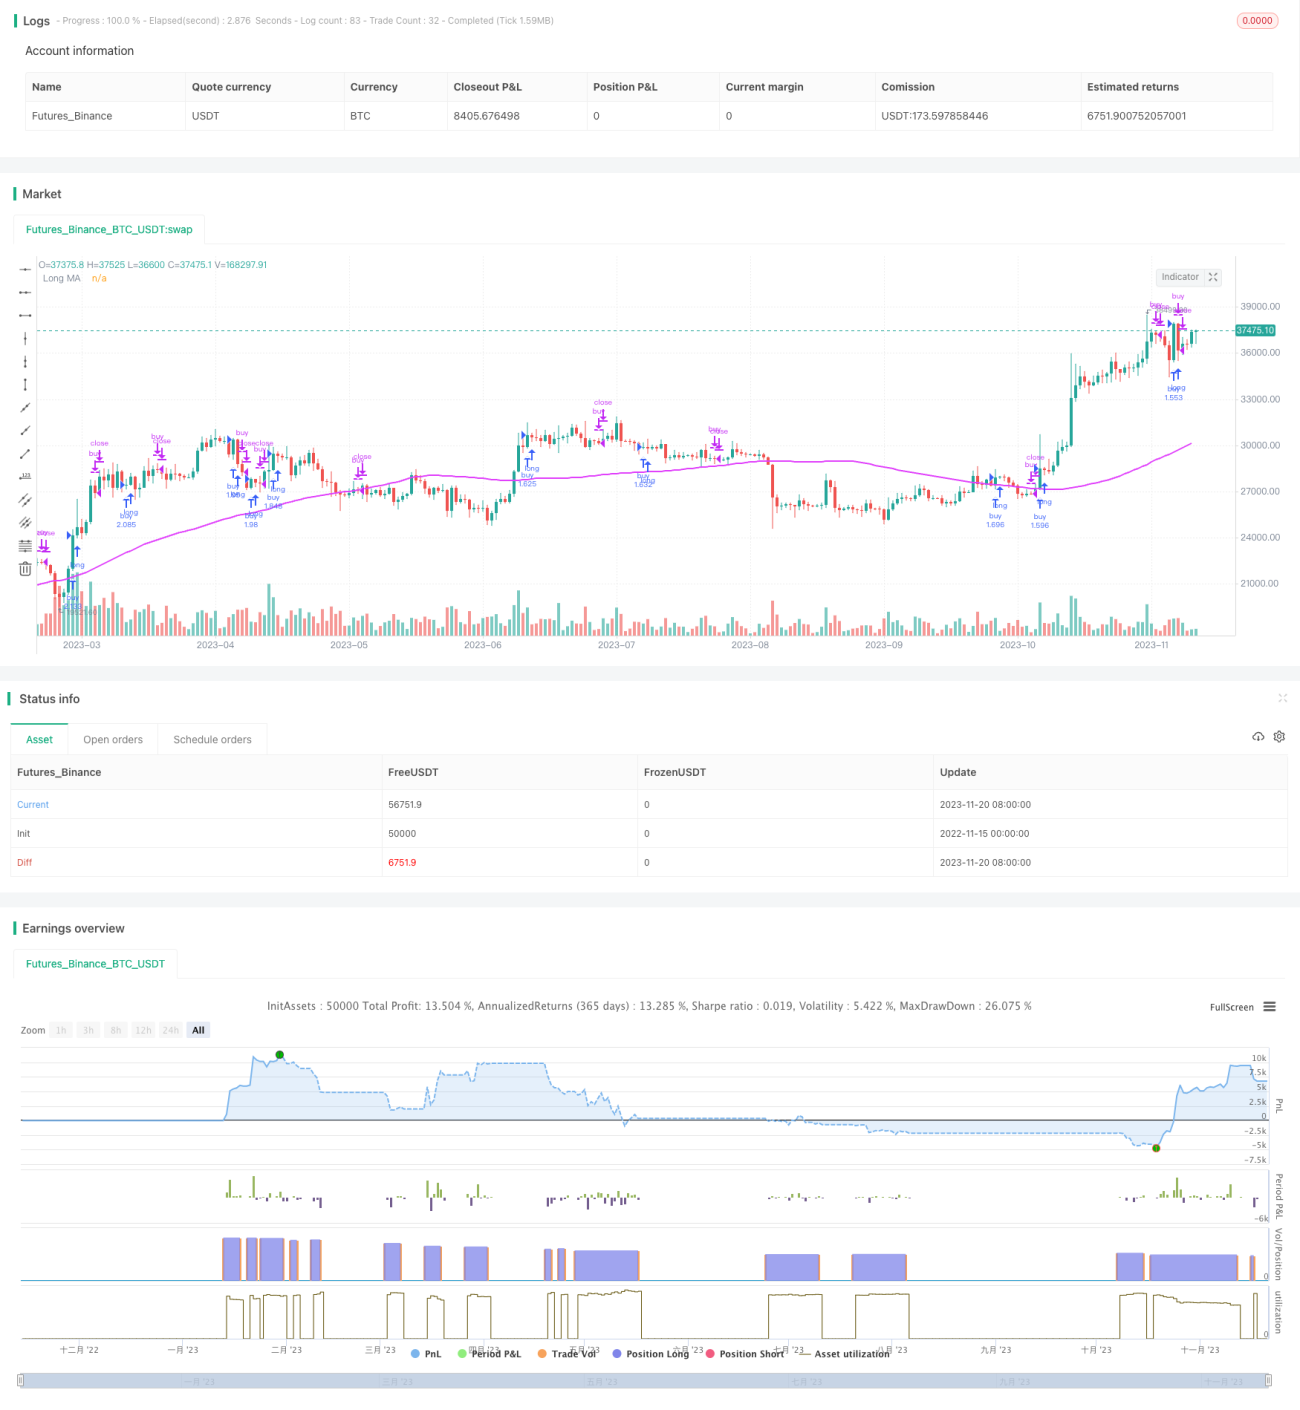
/*backtest
start: 2022-11-15 00:00:00
end: 2023-11-21 00:00:00
period: 1d
basePeriod: 1h
exchanges: [{"eid":"Futures_Binance","currency":"BTC_USDT"}]
*/

//@version=3
strategy("Up Down", "Up Down", precision = 6, pyramiding = 1, default_qty_type = strategy.percent_of_equity, default_qty_value = 99, commission_type = strategy.commission.percent, commission_value = 0.0, initial_capital = 1000, overlay = true)

buy = close > open and open > close[1]Strategy parameters
Related strategies
Comment
All comments (0)
No data
- 1