Chiến lược giao cắt đường trung bình động theo xu hướng hai chiều

1
Follow
1779
Followers
Tổng quan
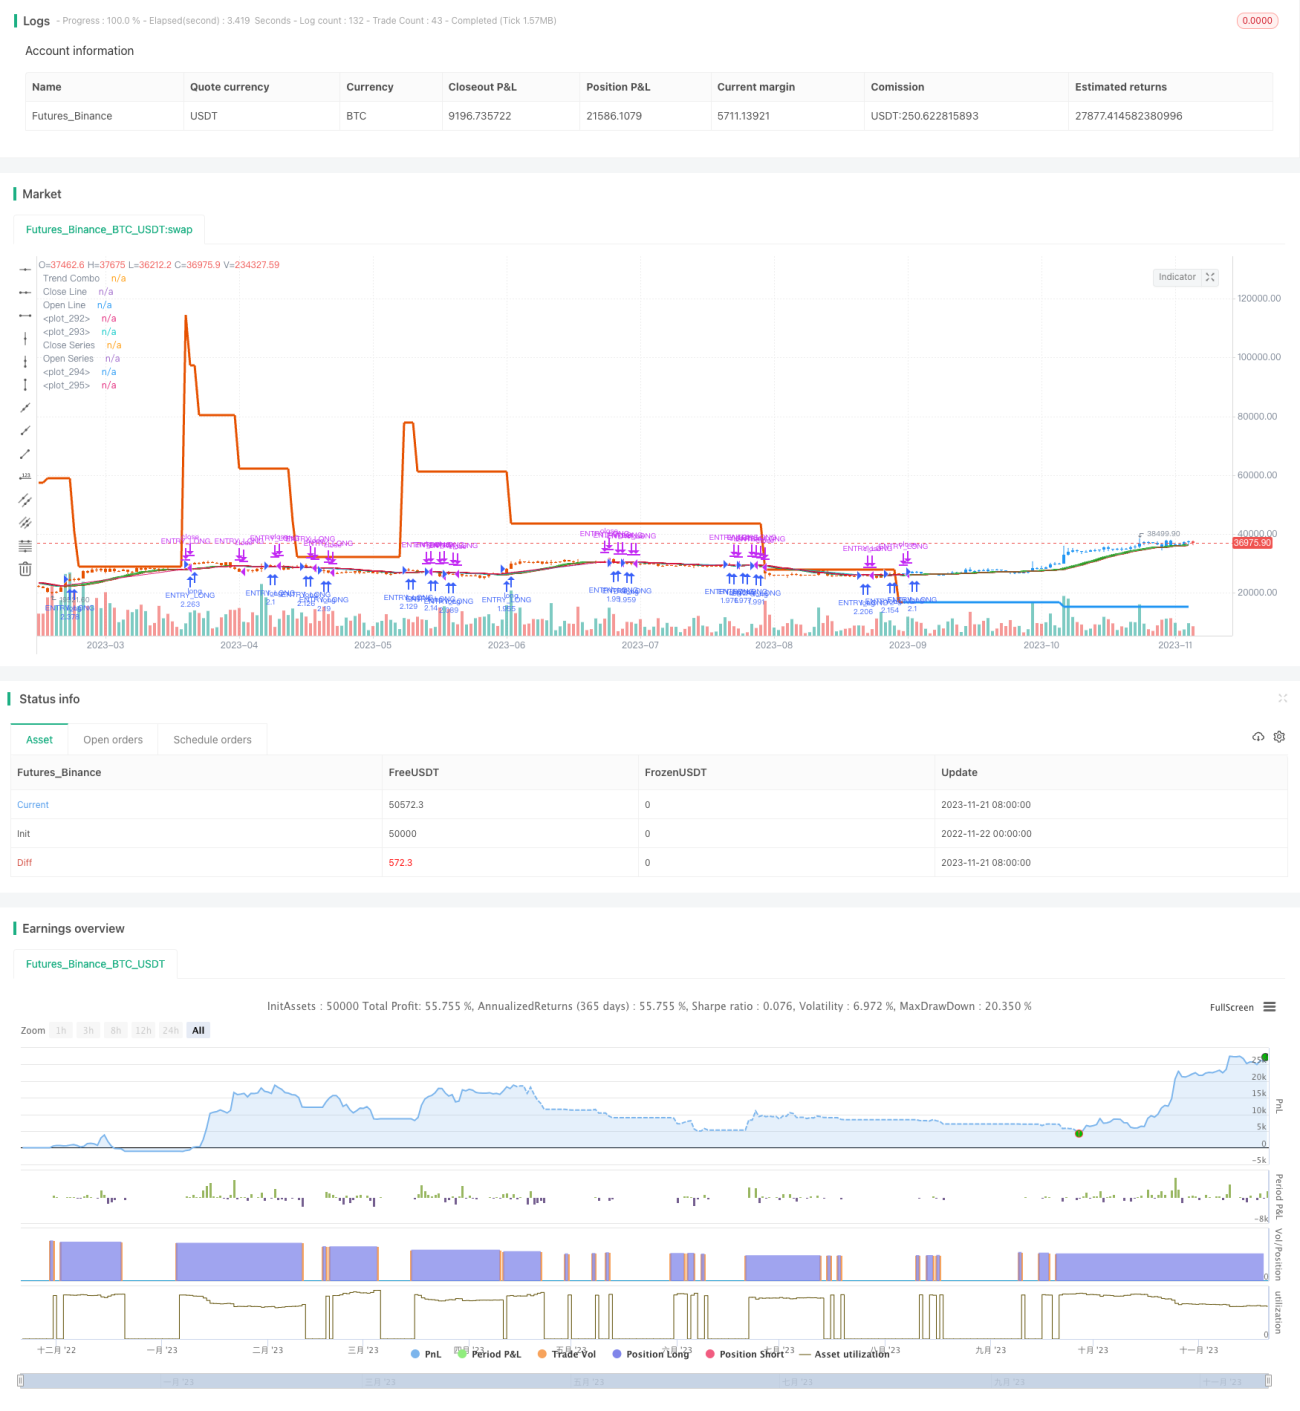
Chiến lược này thực hiện một chiến lược giao dịch chéo có thể tự động theo dõi xu hướng giá bằng cách tính toán các đường trung bình di chuyển trơn hai chiều, kết hợp với các chỉ số xu hướng. Chiến lược này được thiết kế để theo dõi xu hướng dài hạn và thu được lợi nhuận lớn hơn trong xu hướng mạnh.
Nguyên tắc chiến lược
- Tính trung bình di chuyển trơn hai chiều của giá, bao gồm trung bình giá mở và trung bình giá đóng.
- Chỉ số xu hướng giá sử dụng hệ số liên quan và chỉ số ATR.
- Kết hợp chỉ số xu hướng giá với đường trung bình di chuyển hai chiều để có được một phán đoán xu hướng tổng hợp.
- Khi giá mở trung bình và giá đóng trung bình xảy ra Gold Fork, hãy làm nhiều; khi xảy ra Dead Fork, hãy giữ vị trí bằng phẳng.
- Đồng thời kết hợp với chỉ số xu hướng, chỉ khi chỉ số xu hướng cũng đồng thời làm nhiều, bạn có thể mở nhiều vị trí, chỉ khi chỉ số xu hướng cũng đồng thời trống, bạn có thể mở vị trí trống.
Lợi thế chiến lược
- Đường trung bình di chuyển hai chiều theo dõi xu hướng giá trơn tru và ổn định hơn.
- Kết hợp với các chỉ số xu hướng, bạn có thể đánh giá tốt hơn về xu hướng và tránh giao dịch sai.
- Các nhà giao dịch đã sử dụng các loại hình giao dịch khác nhau để xác định thời gian giao dịch cụ thể.
- Có thể điều chỉnh thông qua các tham số về độ mịn của sự lựa chọn tự do để phù hợp với nhiều môi trường thị trường hơn.
- Nhiều chỉ số được xác thực với nhau, có thể làm giảm tín hiệu giả.
Rủi ro chiến lược
- Rủi ro bị bỏ lỡ sự đảo ngược ở điểm biến hướng. Điều này có thể được giảm bằng cách điều chỉnh chu kỳ trung bình di chuyển.
- Các đường trung bình di chuyển hai chiều tự nó có độ trễ lớn hơn và cần được xác minh lẫn nhau với các chỉ số xu hướng.
- Chu kỳ trung bình di chuyển không phù hợp có thể dẫn đến tần suất giao dịch quá cao hoặc bỏ lỡ thời gian giao dịch tốt.
- Cần thử nghiệm nhiều lần các tham số tối ưu hóa để thích ứng với các chu kỳ và môi trường thị trường khác nhau.
Hướng tối ưu hóa chiến lược
- Kiểm tra nhiều loại chỉ số trung bình di chuyển.
- Thử các loại chỉ số xu hướng khác.
- Các tham số để tối ưu hóa các chỉ số xu hướng và trung bình di chuyển.
- Thử kết hợp với các chỉ số khác, chẳng hạn như chỉ số tỷ lệ dao động.
- Thêm chiến lược dừng lỗ.
Tóm tắt
Chiến lược này dự đoán xu hướng giá từ nhiều chiều và có thể theo dõi xu hướng đường dài một cách ổn định sau khi tối ưu hóa tham số. Tuy nhiên, cần lưu ý để tránh tối ưu hóa và đo lường quá mức. Nói chung, chiến lược này thực hiện theo dõi xu hướng đường dài với rủi ro thấp hơn và đáng để nghiên cứu và áp dụng thêm.
Source
Pine
Strategy parameters
Related strategies
Comment
All comments (0)
No data
- 1