
Chiến lược này sử dụng nhiều chỉ số kỹ thuật để tạo ra tín hiệu giao dịch. Chiến lược sử dụng 123 hình dạng phán đoán điểm đảo ngược, tạo ra tín hiệu kết hợp với chỉ số CSI ergodic, để thực hiện theo dõi xu hướng. Chiến lược này nhằm mục đích nắm bắt xu hướng đường ngắn trung bình, để có được lợi nhuận cao hơn.
Chiến lược này bao gồm hai phần:
Xác định hình thức 123 là xác định giá đảo ngược thông qua mối quan hệ giá đóng cửa của 3 đường K gần đây nhất. Nếu hai dòng K trước và cuối cùng tăng giá và chỉ số stoch hiện tại thấp hơn 50, đó là tín hiệu mua. Nếu hai đường K trước và một đường K sau giảm giá và chỉ số Stoch hiện tại đều cao hơn 50, thì đó là tín hiệu bán.
Chỉ số CSI ergodic xem xét nhiều yếu tố như giá cả, sóng thực tế, chỉ số xu hướng, đánh giá tổng hợp xu hướng thị trường, tạo ra khu vực mua và bán. Tín hiệu mua được tạo ra khi chỉ số cao hơn khu vực mua và tín hiệu bán được tạo ra khi thấp hơn khu vực bán.
Cuối cùng, tín hiệu đảo ngược hình dạng 123 với tín hiệu quỹ đạo của ergodic CSI được vận hành theo cách pha trộn và pha trộn, để có được tín hiệu chiến lược cuối cùng.
Chiến lược này có thể theo dõi hiệu quả xu hướng đường ngắn giữa và giữa bằng cách kết hợp hình thức đảo ngược với hai đường ray. Với mức độ ổn định và lợi nhuận cao hơn so với chỉ số kỹ thuật đơn lẻ. Bước tiếp theo sẽ tối ưu hóa các tham số hơn nữa và thêm các mô-đun dừng lỗ và chọn cổ phiếu để giảm rút và nâng cao hiệu quả tổng thể.
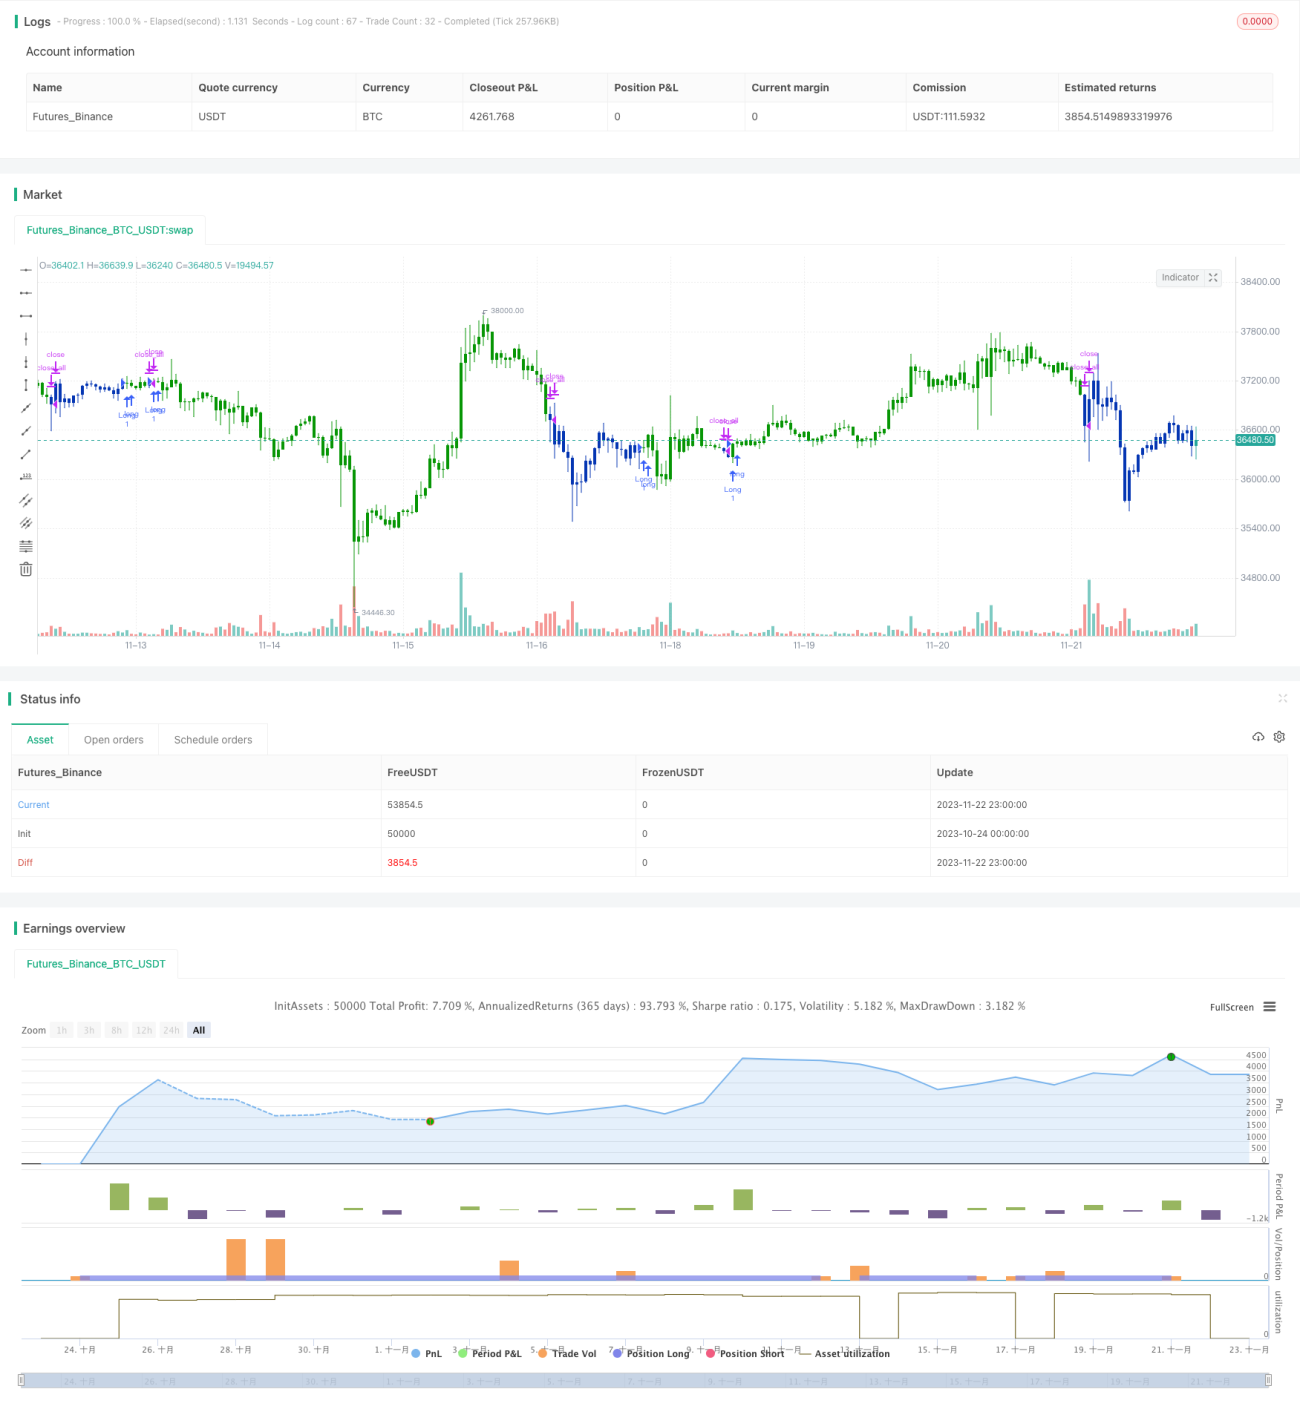
/*backtest
start: 2023-10-24 00:00:00
end: 2023-11-23 00:00:00
period: 1h
basePeriod: 15m
exchanges: [{"eid":"Futures_Binance","currency":"BTC_USDT"}]
*/
//@version=4
////////////////////////////////////////////////////////////
// Copyright by HPotter v1.0 22/07/2020
// This is combo strategies for get a cumulative signal.
//
// First strategy
// This System was created from the Book "How I Tripled My Money In The
// Futures Market" by Ulf Jensen, Page 183. This is reverse type of strategies.
// The strategy buys at market, if close price is higher than the previous close
// during 2 days and the meaning of 9-days Stochastic Slow Oscillator is lower than 50.
// The strategy sells at market, if close price is lower than the previous close price
// during 2 days and the meaning of 9-days Stochastic Fast Oscillator is higher than 50.
//
// Second strategy
// This is one of the techniques described by William Blau in his book
// "Momentum, Direction and Divergence" (1995). If you like to learn more,
// we advise you to read this book. His book focuses on three key aspects
// of trading: momentum, direction and divergence. Blau, who was an electrical
// engineer before becoming a trader, thoroughly examines the relationship between
// price and momentum in step-by-step examples. From this grounding, he then looks
// at the deficiencies in other oscillators and introduces some innovative techniques,
// including a fresh twist on Stochastics. On directional issues, he analyzes the
// intricacies of ADX and offers a unique approach to help define trending and
// non-trending periods.
// This indicator plots Ergotic CSI and smoothed Ergotic CSI to filter out noise.
//
// WARNING:
// - For purpose educate only
// - This script to change bars colors.
////////////////////////////////////////////////////////////
Reversal123(Length, KSmoothing, DLength, Level) =>
vFast = sma(stoch(close, high, low, Length), KSmoothing)
vSlow = sma(vFast, DLength)
pos = 0.0
pos := iff(close[2] < close[1] and close > close[1] and vFast < vSlow and vFast > Level, 1,
iff(close[2] > close[1] and close < close[1] and vFast > vSlow and vFast < Level, -1, nz(pos[1], 0)))
pos
fADX(Len) =>
up = change(high)
down = -change(low)
trur = rma(tr, Len)
plus = fixnan(100 * rma(up > down and up > 0 ? up : 0, Len) / trur)
minus = fixnan(100 * rma(down > up and down > 0 ? down : 0, Len) / trur)
sum = plus + minus
100 * rma(abs(plus - minus) / (sum == 0 ? 1 : sum), Len)
ECSI(r,Length,BigPointValue,SmthLen,SellZone,BuyZone) =>
pos = 0
source = close
K = 100 * (BigPointValue / sqrt(r) / (150 + 5))
xTrueRange = atr(1)
xADX = fADX(Length)
xADXR = (xADX + xADX[1]) * 0.5
nRes = iff(Length + xTrueRange > 0, K * xADXR * xTrueRange / Length,0)
xCSI = iff(close > 0, nRes / close, 0)
xSMA_CSI = sma(xCSI, SmthLen)
pos := iff(xSMA_CSI > BuyZone, 1,
iff(xSMA_CSI <= SellZone, -1, nz(pos[1], 0)))
pos
strategy(title="Combo Backtest 123 Reversal & Ergodic CSI", shorttitle="Combo", overlay = true)
Length = input(14, minval=1)
KSmoothing = input(1, minval=1)
DLength = input(3, minval=1)
Level = input(50, minval=1)
//-------------------------
r = input(32, minval=1)
LengthECSI = input(1, minval=1)
BigPointValue = input(1.0, minval=0.00001)
SmthLen = input(5, minval=1)
SellZone = input(0.06, minval=0.00001)
BuyZone = input(0.02, minval=0.001)
reverse = input(false, title="Trade reverse")
posReversal123 = Reversal123(Length, KSmoothing, DLength, Level)
posECSI = ECSI(r,LengthECSI,BigPointValue,SmthLen,SellZone,BuyZone)
pos = iff(posReversal123 == 1 and posECSI == 1 , 1,
iff(posReversal123 == -1 and posECSI == -1, -1, 0))
possig = iff(reverse and pos == 1, -1,
iff(reverse and pos == -1 , 1, pos))
if (possig == 1)
strategy.entry("Long", strategy.long)
if (possig == -1)
strategy.entry("Short", strategy.short)
if (possig == 0)
strategy.close_all()
barcolor(possig == -1 ? #b50404: possig == 1 ? #079605 : #0536b3 )