Chiến lược phá vỡ giá phân số chuẩn

Tổng quan
Chiến lược phá vỡ giá Z-Score sử dụng chỉ số điểm chuẩn của giá để xác định liệu giá hiện tại có ở trạng thái bất thường hay không, do đó tạo ra tín hiệu giao dịch. Khi điểm chuẩn của giá cao hơn hoặc thấp hơn một ngưỡng nhất định, nó cho thấy giá đã đi vào trạng thái bất thường, khi đó có thể thực hiện hoạt động nhiều hoặc trống.
Nguyên tắc chiến lược
Chỉ số cốt lõi của chiến lược này là điểm chuẩn của giá (Z-Score), công thức tính toán như sau:
mylang
Z_score = (C - SMA(n)) / StdDev(C,n)
Trong đó C là giá đóng cửa, SMA ((n) là đường trung bình di chuyển đơn giản trong n chu kỳ, StdDev ((C, n) là chênh lệch tiêu chuẩn của giá đóng cửa trong n chu kỳ.
Điểm chuẩn phản ánh mức độ lệch của giá hiện tại so với giá trung bình. Khi điểm chuẩn giá lớn hơn một mức độ chênh lệch tích cực nào đó (ví dụ: +2), nó cho thấy giá hiện tại đã cao hơn mức độ chênh lệch tiêu chuẩn 2 so với giá trung bình và thuộc mức độ tương đối cao. Khi nhỏ hơn một mức độ chênh lệch tiêu cực nào đó (ví dụ: -2), nó cho thấy giá hiện tại đã thấp hơn mức độ chênh lệch tiêu chuẩn 2 so với giá trung bình và thuộc mức độ tương đối thấp.
Chiến lược này đầu tiên tính toán điểm chuẩn của giá, sau đó đặt một ngưỡng âm dương (như 0 và 0), tạo ra một tín hiệu mua khi điểm chuẩn cao hơn ngưỡng dương và một tín hiệu bán khi thấp hơn ngưỡng âm.
Phân tích lợi thế
- Sử dụng điểm chuẩn giá để xác định giá bất thường là một phương pháp định lượng phổ biến và hiệu quả
- Có thể dễ dàng thực hiện giao dịch hai chiều
- Cài đặt tham số linh hoạt, có thể điều chỉnh chu kỳ, threshold, vv
- Có thể kết hợp với các chỉ số khác để tạo ra hệ thống giao dịch
Phân tích rủi ro
- Chiến lược điểm số tiêu chuẩn là rộng rãi, dễ tạo ra tín hiệu sai
- Cần thiết lập các tham số thích hợp, chẳng hạn như chu kỳ và threshold
- Cần phải cân nhắc chiến lược kiểm soát rủi ro
Hướng tối ưu hóa
- Tối ưu hóa tham số chu kỳ, tìm chu kỳ tối ưu
- Tối ưu hóa ngưỡng âm dương, giảm tín hiệu giả
- Thêm điều kiện lọc, kết hợp với các chỉ số khác
- Tăng chiến lược dừng lỗ
Tóm tắt
Chiến lược phá vỡ giá điểm chuẩn đánh giá xem giá hiện tại có ở trạng thái bất thường hay không, giao dịch dựa trên tích cực của điểm chuẩn giá. Chiến lược này đơn giản, dễ dàng, có thể giao dịch hai chiều, nhưng cũng có một số rủi ro. Bằng các phương tiện như tối ưu hóa tham số và dừng lỗ, bạn có thể tăng cường chiến lược này để tạo thành một hệ thống giao dịch định lượng đầy đủ với các chỉ số khác.
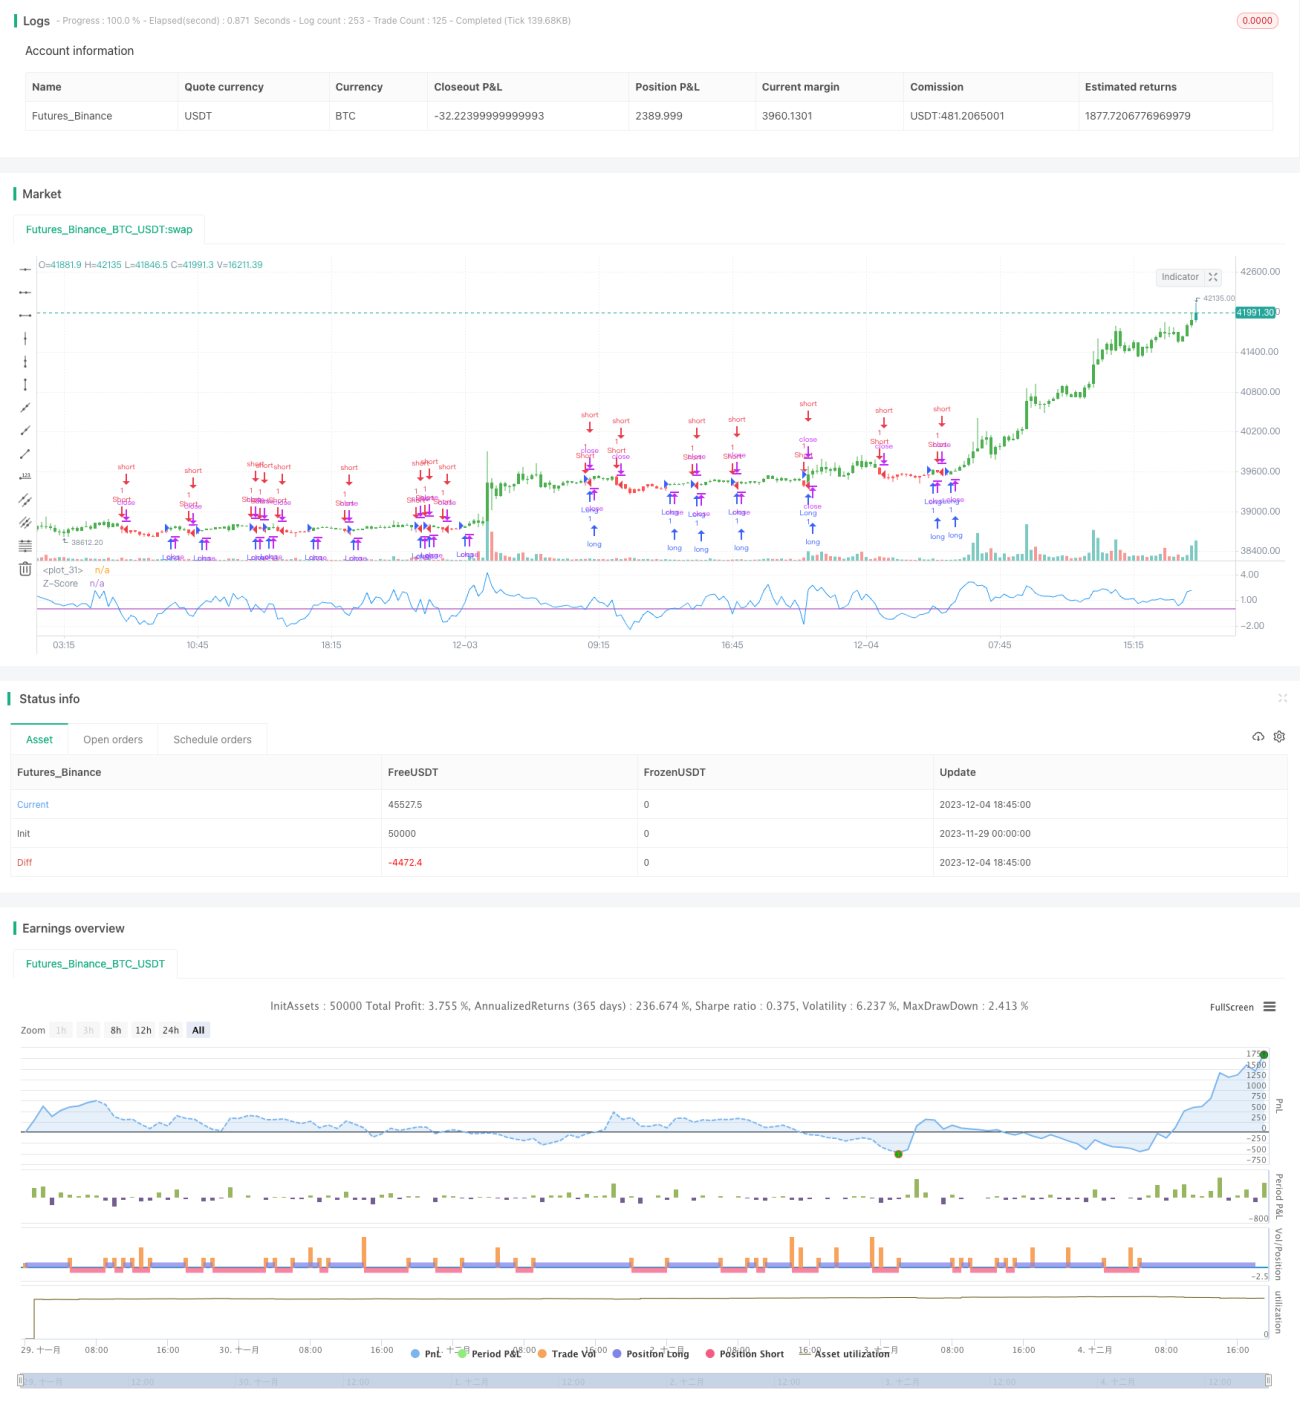
/*backtest
start: 2023-11-29 00:00:00
end: 2023-12-04 19:00:00
period: 15m
basePeriod: 5m
exchanges: [{"eid":"Futures_Binance","currency":"BTC_USDT"}]
*/

//@version=2
////////////////////////////////////////////////////////////
//  Copyright by HPotter v1.0 18/01/2017
// The author of this indicator is Veronique Valcu. The z-score (z) for a data - 1