Chiến lược theo dõi xu hướng dựa trên kNN


Ngày tạo: 2023-12-08 11:33:31 sửa đổi lần cuối: 2023-12-08 11:33:31
sao chép: 0 Số nhấp chuột: 1511
1
tập trung vào
1621
Người theo dõi

Chiến lược theo dõi xu hướng dựa trên kNN

Tổng quan

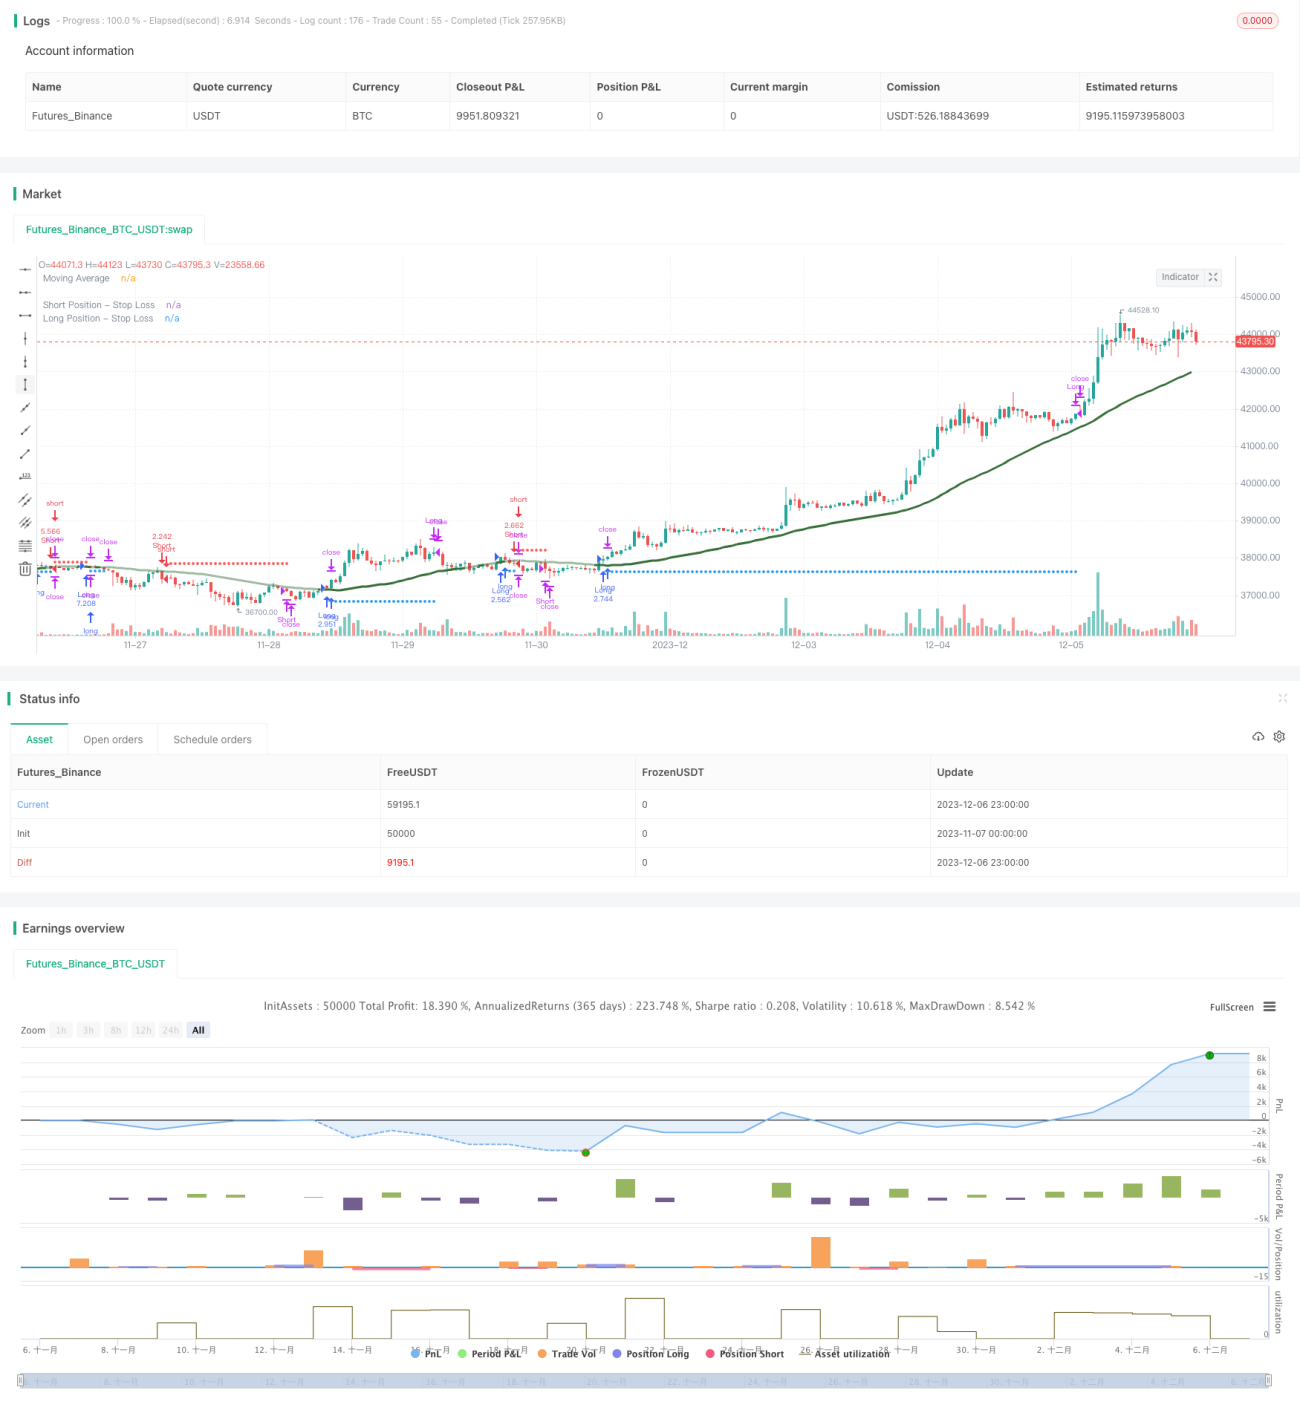
Chiến lược này sử dụng k neighborhood (kNN) thuật toán học máy để dự đoán xu hướng thị trường và tạo ra tín hiệu vị trí dài và vị trí trống dựa trên kết quả dự đoán. Chiến lược này xem xét nhiều yếu tố như dữ liệu lịch sử, chỉ số kỹ thuật, thu được đặc điểm thị trường bằng cách đào tạo động thái mô hình kNN và thực hiện giao dịch theo dõi xu hướng tự động.

Nguyên tắc chiến lược

  1. Thu thập dữ liệu đào tạo: thu thập các chuỗi thời gian như giá đóng cửa lịch sử, khối lượng giao dịch và các chỉ số kỹ thuật như RSI, CCI.

  2. Quá trình xử lý trước dữ liệu: Tiêu chuẩn hóa chỉ số trong khoảng 0-100

  3. Đào tạo mô hình kNN: nhập hai đặc điểm trong mô hình kNN hiện tại, tính khoảng cách theo kiểu châu Âu giữa các vector đặc điểm này và vector đặc điểm lịch sử, chọn khoảng cách gần nhất k mẫu lịch sử, thống kê phân bố nhãn của k mẫu này (vô đầu hoặc đầu trống).

  4. Nhận được dự báo: Dự báo xu hướng thị trường hiện tại dựa trên các nhãn của k mẫu gần nhất. Nếu dự báo là nhiều đầu, tạo ra tín hiệu dài; Nếu dự báo là đầu trống, tạo ra tín hiệu trống.

  5. Giao dịch với các bộ lọc như dừng lỗ, kiểm soát vị trí, trung bình di chuyển.

Lợi thế chiến lược

  1. Nó sử dụng các thuật toán học máy để tự động xác định hình thức công nghệ mà không cần sự can thiệp của con người.

  2. Có thể lựa chọn các chỉ số kỹ thuật khác nhau một cách linh hoạt như là mô hình đặc trưng, chiến lược tối ưu hóa thời gian thực.

  3. Một cơ chế kiểm soát rủi ro nghiêm ngặt như dừng lỗ, quản lý vị trí.

  4. Hình ảnh hiển thị đường dừng, trực quan rõ ràng.

Rủi ro và giải pháp

  1. Mô hình tối ưu hóa có thể được chọn cho các giá trị k thích hợp, vector đặc trưng, phạm vi thời gian mẫu.

  2. Có những rủi ro tiềm ẩn khi giao dịch đơn phương. Thêm giao dịch song phương vào mã có thể giúp loại bỏ các lỗi.

  3. Thiết lập tham số không đúng có thể dẫn đến giao dịch quá mức. Các tham số như kích thước vị trí, tần suất giao dịch nên được điều chỉnh thích hợp.

Hướng tối ưu hóa

  1. Kiểm tra các loại chỉ số kỹ thuật khác nhau như đặc điểm đầu vào của kNN.

  2. Hãy thử các phương pháp đo khoảng cách khác, chẳng hạn như khoảng cách Manhattan.

  3. Sử dụng khoảng cách mẫu hoặc phân loại chất lượng để điều chỉnh kích thước vị trí.

  4. Thêm tập huấn mô hình, phân chia tập thử nghiệm, tối ưu hóa cuộn.

Tóm tắt

Chiến lược này sử dụng thuật toán kNN cổ điển để dự đoán xu hướng thị trường và thực hiện giao dịch theo xu hướng dựa trên tín hiệu dự đoán. Chiến lược có thể điều chỉnh tham số, có thể kiểm soát rủi ro, có thể cung cấp cho người dùng một chương trình giao dịch tự động hiệu quả. Người dùng có thể liên tục nâng cao hiệu suất chiến lược bằng cách điều chỉnh danh mục chỉ số kỹ thuật, tối ưu hóa mô hình siêu tham số.

Mã nguồn chiến lược
/*backtest
start: 2023-11-07 00:00:00
end: 2023-12-07 00:00:00
period: 1h
basePeriod: 15m
exchanges: [{"eid":"Futures_Binance","currency":"BTC_USDT"}]
*/

// This source code is subject to the terms of the Mozilla Public License 2.0 at https://mozilla.org/MPL/2.0/
// © sosacur01

//@version=5
strategy(title=" kNN-based| Trend Following  | Trend Following", overlay=true, pyramiding=1, commission_type=strategy.commission.percent, commission_value=0.2, initial_capital=10000)

//==========================================
// This script, based on Capissimo's original indicator code, transforms a kNN-based machine learning indicator into a TradingView strategy.
// It incorporates a backtest date range filter, on/off controls for long and short positions, a moving average filter, and dynamic risk management for adaptive position sizing.
// Credit to Capissimo for the foundational kNN algorithm.
//==========================================

//BACKTEST RANGE
useDateFilter = input.bool(true, title="Filter Date Range of Backtest",
     group="Backtest Time Period")
backtestStartDate = input(timestamp("1 jan 2017"), 
     title="Start Date", group="Backtest Time Period",
     tooltip="This start date is in the time zone of the exchange " + 
     "where the chart's instrument trades. It doesn't use the time " + 
     "zone of the chart or of your computer.")
backtestEndDate = input(timestamp("1 Jul 2100"),
     title="End Date", group="Backtest Time Period",
     tooltip="This end date is in the time zone of the exchange " + 
     "where the chart's instrument trades. It doesn't use the time " + 
     "zone of the chart or of your computer.")
inTradeWindow = true
if not inTradeWindow and inTradeWindow[1]
    strategy.cancel_all()
    strategy.close_all(comment="Date Range Exit")

//--------------------------------------

//LONG/SHORT POSITION ON/OFF INPUT
LongPositions   = input.bool(title='On/Off Long Postion', defval=true, group="Long & Short Position")
ShortPositions  = input.bool(title='On/Off Short Postion', defval=true, group="Long & Short Position")

//--------------------------------------
// kNN-based Strategy (FX and Crypto)
// Description: 
// This strategy uses a classic machine learning algorithm - k Nearest Neighbours (kNN) - 
// to let you find a prediction for the next (tomorrow's, next month's, etc.) market move. 
// Being an unsupervised machine learning algorithm, kNN is one of the most simple learning algorithms. 

// To do a prediction of the next market move, the kNN algorithm uses the historic data, 
// collected in 3 arrays - feature1, feature2 and directions, - and finds the k-nearest 
// neighbours of the current indicator(s) values. 

// The two dimensional kNN algorithm just has a look on what has happened in the past when 
// the two indicators had a similar level. It then looks at the k nearest neighbours, 
// sees their state and thus classifies the current point.

// The kNN algorithm offers a framework to test all kinds of indicators easily to see if they 
// have got any *predictive value*. One can easily add cog, wpr and others.
// Note: TradingViews's playback feature helps to see this strategy in action.
// Warning: Signals ARE repainting.

// Style tags: Trend Following, Trend Analysis
// Asset class: Equities, Futures, ETFs, Currencies and Commodities
// Dataset: FX Minutes/Hours+++/Days

//-- Preset Dates

int startdate = timestamp('01 Jan 2000 00:00:00 GMT+10')
int stopdate  = timestamp('31 Dec 2025 23:45:00 GMT+10')

//-- Inputs

StartDate  = input  (startdate, 'Start Date', group="kNN-based Inputs")
StopDate   = input  (stopdate,  'Stop Date', group="kNN-based Inputs")
Indicator  = input.string('RSI',     'Indicator',   ['RSI','ROC','CCI','Volume','All'], group="kNN-based Inputs")
ShortWinow = input.int   (8,        'Short Period [1..n]', 1, group="kNN-based Inputs")
LongWindow = input.int   (29,        'Long Period [2..n]',  2, group="kNN-based Inputs")
BaseK      = input.int   (400,       'Base No. of Neighbours (K) [5..n]', 5, group="kNN-based Inputs")
Filter     = input.bool  (false,     'Volatility Filter', group="kNN-based Inputs")
Bars       = input.int   (300,       'Bar Threshold [2..5000]', 2, 5000, group="kNN-based Inputs")

//-- Constants

var int BUY   = 1
var int SELL  =-1
var int CLEAR = 0

var int k     = math.floor(math.sqrt(BaseK))  // k Value for kNN algo

//-- Variable

// Training data, normalized to the range of [0,...,100]
var array<float> feature1   = array.new_float(0)  // [0,...,100]
var array<float> feature2   = array.new_float(0)  //    ...
var array<int>   directions = array.new_int(0)    // [-1; +1]

// Result data
var array<int>   predictions = array.new_int(0)
var float        prediction  = 0.0
var array<int>   bars        = array.new<int>(1, 0) // array used as a container for inter-bar variables

// Signals
var int          signal      = CLEAR

//-- Functions

minimax(float x, int p, float min, float max) => 
    float hi = ta.highest(x, p), float lo = ta.lowest(x, p)
    (max - min) * (x - lo)/(hi - lo) + min

cAqua(int g) => g>9?#0080FFff:g>8?#0080FFe5:g>7?#0080FFcc:g>6?#0080FFb2:g>5?#0080FF99:g>4?#0080FF7f:g>3?#0080FF66:g>2?#0080FF4c:g>1?#0080FF33:#00C0FF19
cPink(int g) => g>9?#FF0080ff:g>8?#FF0080e5:g>7?#FF0080cc:g>6?#FF0080b2:g>5?#FF008099:g>4?#FF00807f:g>3?#FF008066:g>2?#FF00804c:g>1?#FF008033:#FF008019

inside_window(float start, float stop) =>  
    time >= start and time <= stop ? true : false

//-- Logic

bool window = true

// 3 pairs of predictor indicators, long and short each
float rs = ta.rsi(close,   LongWindow),        float rf = ta.rsi(close,   ShortWinow)
float cs = ta.cci(close,   LongWindow),        float cf = ta.cci(close,   ShortWinow)
float os = ta.roc(close,   LongWindow),        float of = ta.roc(close,   ShortWinow)
float vs = minimax(volume, LongWindow, 0, 99), float vf = minimax(volume, ShortWinow, 0, 99)

// TOADD or TOTRYOUT:
//    ta.cmo(close, LongWindow), ta.cmo(close, ShortWinow)
//    ta.mfi(close, LongWindow), ta.mfi(close, ShortWinow)
//    ta.mom(close, LongWindow), ta.mom(close, ShortWinow)

float f1 = switch Indicator
    'RSI'    => rs 
    'CCI'    => cs 
    'ROC'    => os 
    'Volume' => vs 
    => math.avg(rs, cs, os, vs)

float f2 = switch Indicator
    'RSI'    => rf 
    'CCI'    => cf
    'ROC'    => of
    'Volume' => vf 
    => math.avg(rf, cf, of, vf)

// Classification data, what happens on the next bar
int class_label = int(math.sign(close[1] - close[0])) // eq. close[1]<close[0] ? SELL: close[1]>close[0] ? BUY : CLEAR

// Use particular training period
if window
    // Store everything in arrays. Features represent a square 100 x 100 matrix,
    // whose row-colum intersections represent class labels, showing historic directions
    array.push(feature1, f1)
    array.push(feature2, f2)
    array.push(directions, class_label)

// Ucomment the followng statement (if barstate.islast) and tab everything below
// between BOBlock and EOBlock marks to see just the recent several signals gradually 
// showing up, rather than all the preceding signals

//if barstate.islast   

//==BOBlock	

// Core logic of the algorithm
int   size    = array.size(directions)
float maxdist = -999.0
// Loop through the training arrays, getting distances and corresponding directions.
for i=0 to size-1
    // Calculate the euclidean distance of current point to all historic points,
    // here the metric used might as well be a manhattan distance or any other.
    float d = math.sqrt(math.pow(f1 - array.get(feature1, i), 2) + math.pow(f2 - array.get(feature2, i), 2))
    
    if d > maxdist
        maxdist := d
        if array.size(predictions) >= k
            array.shift(predictions)
        array.push(predictions, array.get(directions, i))
        
//==EOBlock	

// Note: in this setup there's no need for distances array (i.e. array.push(distances, d)),
//       but the drawback is that a sudden max value may shadow all the subsequent values.
// One of the ways to bypass this is to:
// 1) store d in distances array,
// 2) calculate newdirs = bubbleSort(distances, directions), and then 
// 3) take a slice with array.slice(newdirs) from the end
    	
// Get the overall prediction of k nearest neighbours
prediction := array.sum(predictions)   

bool filter = Filter ? ta.atr(10) > ta.atr(40) : true // filter out by volatility or ex. ta.atr(1) > ta.atr(10)...

// Now that we got a prediction for the next market move, we need to make use of this prediction and 
// trade it. The returns then will show if everything works as predicted.
// Over here is a simple long/short interpretation of the prediction, 
// but of course one could also use the quality of the prediction (+5 or +1) in some sort of way,
// ex. for position sizing.

bool long  = prediction > 0 and filter
bool short = prediction < 0 and filter
bool clear = not(long and short)

if array.get(bars, 0)==Bars    // stop by trade duration
    signal := CLEAR
    array.set(bars, 0, 0)
else
    array.set(bars, 0, array.get(bars, 0) + 1)

signal := long ? BUY : short ? SELL : clear ? CLEAR : nz(signal[1])

int  changed         = ta.change(signal)
bool startLongTrade  = changed and signal==BUY 
bool startShortTrade = changed and signal==SELL 
// bool endLongTrade    = changed and signal==SELL
// bool endShortTrade   = changed and signal==BUY  
bool clear_condition = changed and signal==CLEAR //or (changed and signal==SELL) or (changed and signal==BUY)

float maxpos = ta.highest(high, 10)
float minpos = ta.lowest (low,  10)


//----//MA INPUTS
MAFilter        = input.bool(title='Use MA as Filter', defval=true, group = "MA Inputs")
averageType1    = input.string(defval="SMA", group="MA Inputs", title="MA Type", options=["SMA", "EMA", "WMA", "HMA", "RMA", "SWMA", "ALMA", "VWMA", "VWAP"])
averageLength1  = input.int(defval=40, title="MA Length", group="MA Inputs")
averageSource1  = input(close, title="MA Source", group="MA Inputs")        

//MA TYPE
MovAvgType1(averageType1, averageSource1, averageLength1) =>
	switch str.upper(averageType1)
        "SMA"  => ta.sma(averageSource1, averageLength1)
        "EMA"  => ta.ema(averageSource1, averageLength1)
        "WMA"  => ta.wma(averageSource1, averageLength1)
        "HMA"  => ta.hma(averageSource1, averageLength1)
        "RMA"  => ta.rma(averageSource1, averageLength1)
        "SWMA" => ta.swma(averageSource1)
        "ALMA" => ta.alma(averageSource1, averageLength1, 0.85, 6)
        "VWMA" => ta.vwma(averageSource1, averageLength1)
        "VWAP" => ta.vwap(averageSource1)
        => runtime.error("Moving average type '" + averageType1 + 
             "' not found!"), na


// MA COLOR VALUES
ma = MovAvgType1(averageType1, averageSource1, averageLength1)
ma_plot = close > ma ? color.rgb(54, 111, 56) : color.rgb(54, 111, 56, 52)

// MA BUY/SELL CONDITIONS
bullish_ma = MAFilter ? close > ma  : inTradeWindow
bearish_ma = MAFilter ? close < ma  : inTradeWindow

// MA ALTERNATING PLOT
plot(MAFilter ? ma : na, color=ma_plot, title="Moving Average", linewidth=3)
//--------------------------------------

//ENTRIES AND EXITS
long_entry  = if inTradeWindow and startLongTrade and bullish_ma and LongPositions
    true
long_exit   = if inTradeWindow and startShortTrade
    true

short_entry = if inTradeWindow and startShortTrade and bearish_ma and ShortPositions
    true
short_exit  = if inTradeWindow and startLongTrade
    true
    
//--------------------------------------
//RISK MANAGEMENT - SL, MONEY AT RISK, POSITION SIZING
atrPeriod                = input.int(7, "ATR Length", group="Risk Management Inputs")
sl_atr_multiplier        = input.float(title="Long Position - Stop Loss - ATR Multiplier", defval=2, group="Risk Management Inputs", step=0.5)
sl_atr_multiplier_short  = input.float(title="Short Position - Stop Loss - ATR Multiplier", defval=2, group="Risk Management Inputs", step=0.5)
i_pctStop                = input.float(2, title="% of Equity at Risk", step=.5, group="Risk Management Inputs")/100

//ATR VALUE
_atr = ta.atr(atrPeriod)

//CALCULATE LAST ENTRY PRICE
lastEntryPrice = strategy.opentrades.entry_price(strategy.opentrades - 1)

//STOP LOSS - LONG POSITIONS 
var float sl = na

//CALCULTE SL WITH ATR AT ENTRY PRICE - LONG POSITION
if (strategy.position_size[1] != strategy.position_size)
    sl := lastEntryPrice - (_atr * sl_atr_multiplier)

//IN TRADE - LONG POSITIONS
inTrade = strategy.position_size > 0

//PLOT SL - LONG POSITIONS
plot(inTrade ? sl : na, color=color.blue, style=plot.style_circles, title="Long Position - Stop Loss")

//CALCULATE ORDER SIZE - LONG POSITIONS
positionSize = (strategy.equity * i_pctStop) / (_atr * sl_atr_multiplier)

//============================================================================================

//STOP LOSS - SHORT POSITIONS 
var float sl_short = na

//CALCULTE SL WITH ATR AT ENTRY PRICE - SHORT POSITIONS 
if (strategy.position_size[1] != strategy.position_size)
    sl_short := lastEntryPrice + (_atr * sl_atr_multiplier_short)

//IN TRADE SHORT POSITIONS
inTrade_short = strategy.position_size < 0

//PLOT SL - SHORT POSITIONS
plot(inTrade_short ? sl_short : na, color=color.red, style=plot.style_circles, title="Short Position - Stop Loss")

//CALCULATE ORDER - SHORT POSITIONS
positionSize_short = (strategy.equity * i_pctStop) / (_atr * sl_atr_multiplier_short) 


//===============================================

//LONG STRATEGY
strategy.entry("Long", strategy.long, comment="Long", when = long_entry and not short_entry, qty=positionSize)
if (strategy.position_size > 0)
    strategy.close("Long", when = (long_exit), comment="Close Long")
    strategy.exit("Long", stop = sl, comment="Exit Long")

//SHORT STRATEGY
strategy.entry("Short", strategy.short, comment="Short", when = short_entry and not long_entry, qty=positionSize_short)
if (strategy.position_size < 0) 
    strategy.close("Short", when = (short_exit), comment="Close Short")
    strategy.exit("Short", stop = sl_short, comment="Exit Short")

//ONE DIRECTION TRADING COMMAND (BELLOW ONLY ACTIVATE TO CORRECT BUGS)
//strategy.risk.allow_entry_in(strategy.direction.long)