
Chiến lược này sử dụng kênh nội bộ giá để xác định xu hướng giá trong tương lai, thuộc chiến lược theo dõi xu hướng. Khi giá tạo ra một số kênh biến động giá nội bộ, đánh giá là tín hiệu chuyển hướng xu hướng, mua hoặc bán. Đồng thời kết hợp với lọc đường trung bình di chuyển và thiết lập dừng lỗ để khóa lợi nhuận, thuộc chiến lược giao dịch định lượng phổ biến hơn.
Chiến lược này đánh giá sự hình thành của kênh nội bộ được xác định dựa trên mối quan hệ giữa giá cao nhất và giá thấp nhất của hai dòng K trước và sau. Khi một số dòng K đáp ứng điều kiện giá cao nhất thấp hơn giá cao nhất của dòng K trước và giá thấp nhất cao hơn giá thấp nhất của dòng K trước, thì nó được đánh giá là kênh nội bộ giá.
Trong khi đánh giá sự hình thành của kênh nội bộ giá, chiến lược cũng đánh giá hướng của kênh nội bộ đó. Nếu là kênh nội bộ lạc quan, nó sẽ tạo ra tín hiệu mua; Nếu là kênh nội bộ giảm giá, nó sẽ tạo ra tín hiệu bán. Do đó, chiến lược này thuộc về chiến lược giao dịch hai chiều.
Để lọc các tín hiệu giả mạo, chiến lược này cũng đưa ra chỉ số trung bình di chuyển. Chỉ khi giá trên hoặc dưới trung bình di chuyển, tín hiệu giao dịch thực tế sẽ được tạo ra. Điều này có thể tránh một số giao dịch sai trong việc điều chỉnh thị trường.
Sau khi tham gia, chiến lược cũng sẽ thiết lập điểm dừng lỗ theo lựa chọn của người dùng. Có ba cách dừng lỗ có thể chọn: dừng lỗ cố định, dừng ATR, dừng tối đa hoặc tối thiểu trước đó. Cài đặt dừng là dừng tỷ lệ lợi nhuận rủi ro. Điều này có thể khóa lợi nhuận và kiểm soát rủi ro đến một mức độ nhất định.
Ưu điểm lớn nhất của chiến lược này là khả năng nhận diện các điểm biến động xu hướng mạnh mẽ. Khi giá tạo ra một số kênh nội bộ, thường là dấu hiệu cho thấy sự sụt giảm lớn sắp xảy ra.
Ngoài ra, các chiến lược có thể được cấu hình rất mạnh. Người dùng có thể tự do lựa chọn số lượng các kênh nội bộ, chu kỳ trung bình di chuyển, phương thức dừng lỗ. Điều này cung cấp sự linh hoạt rất lớn cho các loại khác nhau và phong cách giao dịch khác nhau.
Cuối cùng, các chiến lược được thêm vào bộ lọc trung bình di chuyển và thiết lập dừng lỗ cũng làm giảm rủi ro giao dịch. Điều này làm cho chiến lược có thể áp dụng cho giao dịch trong mọi môi trường thị trường.
Rủi ro lớn nhất của chiến lược này là có nhiều khả năng sai lầm trong việc đánh giá xu hướng. Các kênh nội bộ không thể xác định hoàn toàn sự đảo ngược giá, có một xác suất sai lầm nhất định. Nếu số lượng xác định không đủ, có thể có các tín hiệu sai.
Ngoài ra, chiến lược này hoàn toàn không áp dụng trong thị trường cân bằng hoặc dao động. Chiến lược này sẽ liên tục tạo ra tín hiệu sai khi giá dao động lên xuống nhưng không xác định xu hướng. Điều này được quyết định bởi cơ chế chiến lược.
Cuối cùng, thiết lập dừng lỗ quá bảo thủ cũng có thể khiến chiến lược không thể giữ đủ lâu và không thể nắm bắt lợi nhuận trong xu hướng lớn. Điều này đòi hỏi người dùng phải tự cân bằng các thiết lập.
Một số hướng tối ưu hóa có thể bao gồm:
Tối ưu hóa số lượng và hình thức của các kênh nội bộ. Có thể kiểm tra hiệu quả giao dịch dưới số lượng hoặc kết hợp xếp hạng khác nhau.
Tối ưu hóa các tham số chu kỳ của các trung bình di chuyển, cho phép nó đánh giá tốt hơn về hướng xu hướng. Chu kỳ mặc định hiện tại có thể không phù hợp với tất cả các giống.
Thêm các bộ lọc chỉ số khác. Ví dụ, giới thiệu các vùng Brin, chỉ tạo ra tín hiệu giao dịch khi giá vượt qua vùng Brin lên đường hoặc xuống đường.
Tối ưu hóa các tham số dừng lỗ để chiến lược có thể giữ vị trí trong thời gian dài hơn. Do đó, thu được lợi nhuận trong siêu xu hướng.
Nhìn chung, chiến lược này tồn tại nhờ tính chính xác của nó trong việc đánh giá xu hướng. Chỉ cần đảm bảo tính chính xác của phán đoán, cộng với cài đặt quản lý rủi ro thích hợp, giao dịch thuật toán có hiệu quả tốt hơn.
Chiến lược này nói chung là một chiến lược giao dịch định lượng dựa trên các kênh nội bộ giá để xác định xu hướng giá trong tương lai. Nó kết hợp theo dõi xu hướng và đảo ngược xu hướng hai phương pháp phán đoán, có một số lợi thế.
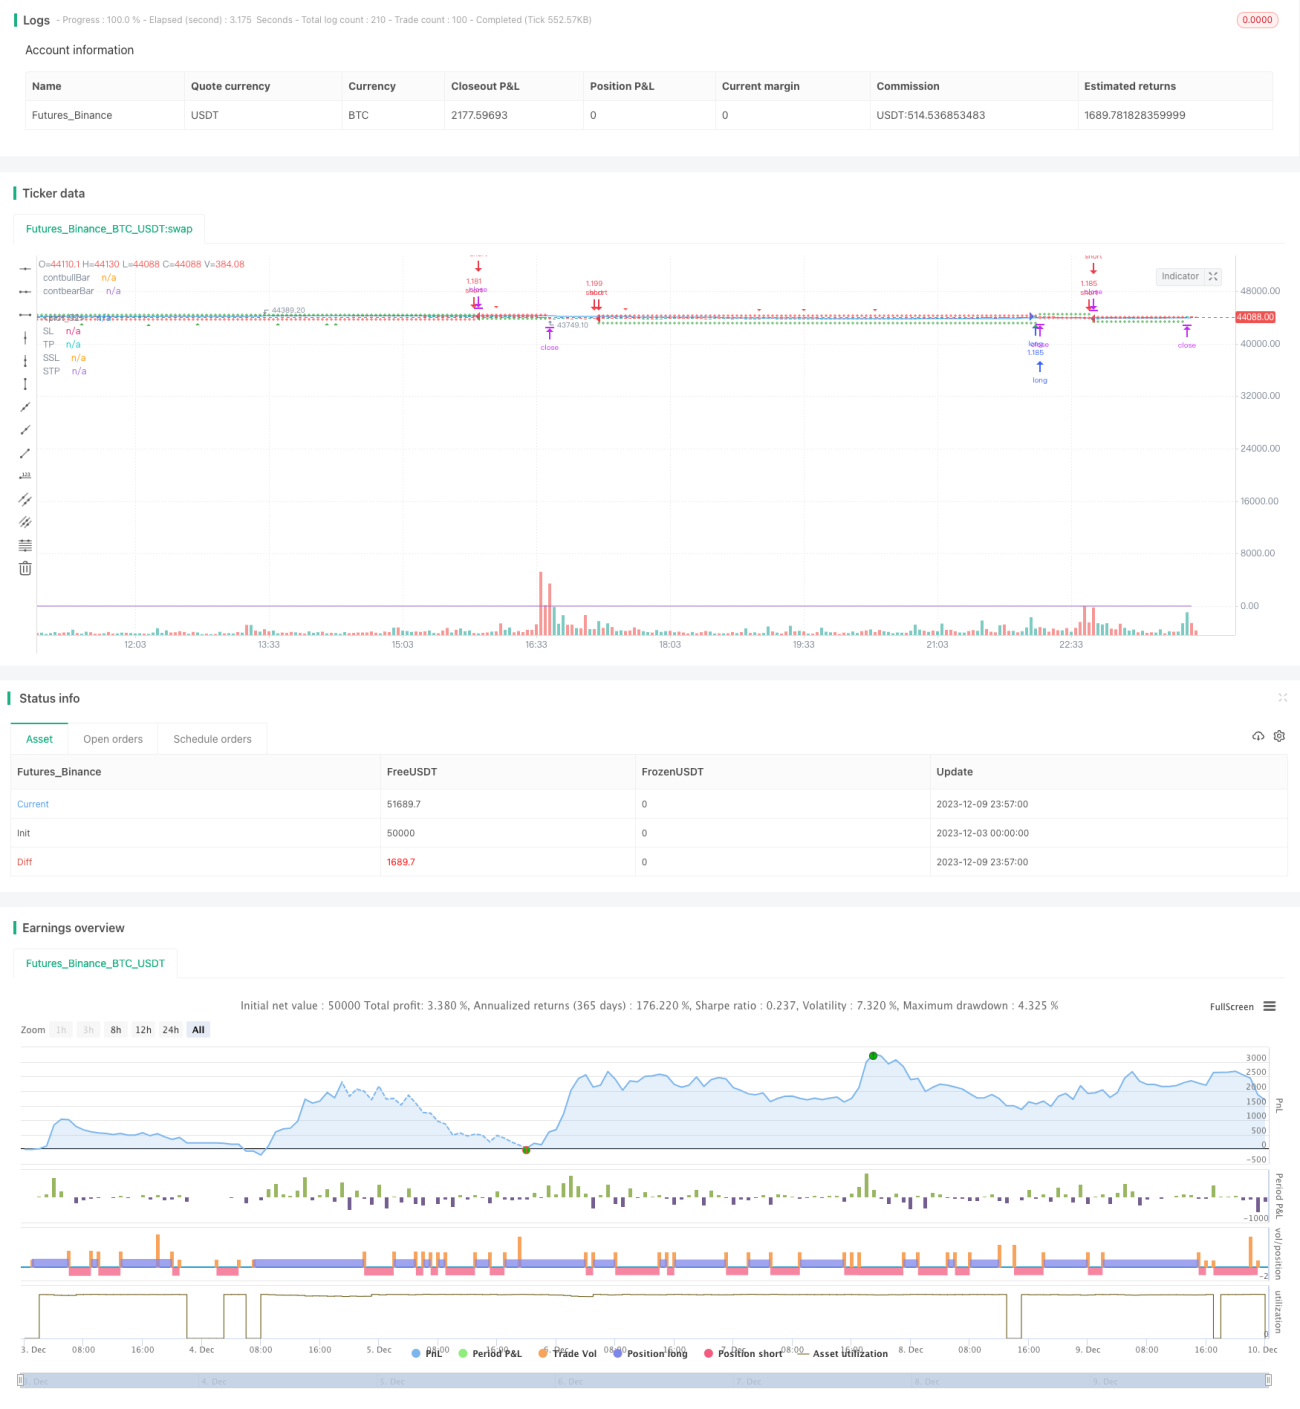
/*backtest
start: 2023-12-03 00:00:00
end: 2023-12-10 00:00:00
period: 3m
basePeriod: 1m
exchanges: [{"eid":"Futures_Binance","currency":"BTC_USDT"}]
*/
// This source code is subject to the terms of the Mozilla Public License 2.0 at https://mozilla.org/MPL/2.0/
// From "Day Trading Cryptocurrency
// Strategies, Tactics, Mindset, and Tools Required To Build Your
// New Income Stream"
// by Phil C. Senior
// "Inside bars are a two -bar pattern. They can indicate either a continuation of the
// existing move or a reversal. A continuation occurs when there is no significant
// support or resistance level in sight, while a reversal occurs close to a strong sup-
// port or resistance level...
// ...A lot of traders are aware of inside bars but few manage to make money with
// them. Why is this so? It goes back to interpreting price action. A lot of traders look
// to trade in geometric ways. What I mean is that they search for fancy shapes on a
// chart and think that this is what represents true price action.
// This is not the case. A shape is just a shape. The formation by itself means
// nothing unless underlying order flow backs it up. This is why it’s extremely impor-
// tant that you look for inside bars when a trend is already in place. The best place to
// look for them is in the beginning of trends."
// © tweakerID
//@version=4
strategy("Inside Bar Strategy w/ SL",
overlay=true,
default_qty_type=strategy.percent_of_equity,
default_qty_value=100,
initial_capital=10000,
commission_value=0.04,
calc_on_every_tick=false,
slippage=0)
direction = input(0, title = "Strategy Direction", type=input.integer, minval=-1, maxval=1)
strategy.risk.allow_entry_in(direction == 0 ? strategy.direction.all : (direction < 0 ? strategy.direction.short : strategy.direction.long))
/////////////////////// STRATEGY INPUTS ////////////////////////////////////////
title1=input(true, "-----------------Strategy Inputs-------------------")
i_NBars = input(defval=1, type=input.integer, title="# Of Inside Bars in pattern", options=[1, 2, 3, 4])
i_BarsDirection = input(false, title="Only trade using complete bullish or bearish patterns")
i_MAFilter = input(true, title="Use MA Trend Filter")
i_MALen = input(65, title="MA Length")
/////////////////////// BACKTESTER /////////////////////////////////////////////
title2=input(true, "-----------------General Inputs-------------------")
// Backtester General Inputs
i_SL=input(true, title="Use Stop Loss and Take Profit")
i_SLType=input(defval="ATR Stop", title="Type Of Stop", options=["Strategy Stop", "Swing Lo/Hi", "ATR Stop"])
i_SPL=input(defval=10, title="Swing Point Lookback")
i_PercIncrement=input(defval=1, step=.1, title="Swing Point SL Perc Increment")*0.01
i_ATR = input(14, title="ATR Length")
i_ATRMult = input(5, step=.1, title="ATR Multiple")
i_TPRRR = input(2, step=.1, title="Take Profit Risk Reward Ratio")
TS=input(false, title="Trailing Stop")
// Bought and Sold Boolean Signal
bought = strategy.position_size > strategy.position_size[1]
or strategy.position_size < strategy.position_size[1]
// Price Action Stop and Take Profit
LL=(lowest(i_SPL))*(1-i_PercIncrement)
HH=(highest(i_SPL))*(1+i_PercIncrement)
LL_price = valuewhen(bought, LL, 0)
HH_price = valuewhen(bought, HH, 0)
entry_LL_price = strategy.position_size > 0 ? LL_price : na
entry_HH_price = strategy.position_size < 0 ? HH_price : na
tp=strategy.position_avg_price + (strategy.position_avg_price - entry_LL_price)*i_TPRRR
stp=strategy.position_avg_price - (entry_HH_price - strategy.position_avg_price)*i_TPRRR
// ATR Stop
ATR=atr(i_ATR)*i_ATRMult
ATRLong = ohlc4 - ATR
ATRShort = ohlc4 + ATR
ATRLongStop = valuewhen(bought, ATRLong, 0)
ATRShortStop = valuewhen(bought, ATRShort, 0)
LongSL_ATR_price = strategy.position_size > 0 ? ATRLongStop : na
ShortSL_ATR_price = strategy.position_size < 0 ? ATRShortStop : na
ATRtp=strategy.position_avg_price + (strategy.position_avg_price - LongSL_ATR_price)*i_TPRRR
ATRstp=strategy.position_avg_price - (ShortSL_ATR_price - strategy.position_avg_price)*i_TPRRR
// Strategy Stop
float LongStop = valuewhen(bought,low[1],0)*(1-i_PercIncrement)
float ShortStop = valuewhen(bought,high[1],0)*(1+i_PercIncrement)
float StratTP = na
float StratSTP = na
/////////////////////// STRATEGY LOGIC /////////////////////////////////////////
MAFilter=close > sma(close, i_MALen)
plot(i_MAFilter ? sma(close, i_MALen) : na)
bullBar=close > open
bearBar=close < open
contbullBar=barssince(not bullBar) >= (i_NBars+1)
contbearBar=barssince(not bearBar) >= (i_NBars+1)
InsideBar(NBars) =>
Inside1Bar=high < high[1] and low > low[1]
Inside2Bar=high < high[2] and low > low[2] and Inside1Bar
Inside3Bar=high < high[3] and low > low[3] and Inside1Bar and Inside2Bar
Inside4Bar=high < high[4] and low > low[4] and Inside1Bar and Inside2Bar and Inside3Bar
if NBars == 1
inside1Bar=Inside1Bar
[inside1Bar]
else if NBars == 2
inside2Bar=Inside2Bar
[inside2Bar]
else if NBars == 3
inside3Bar=Inside3Bar
[inside3Bar]
else if NBars == 4
inside4Bar=Inside4Bar
[inside4Bar]
else
[na]
[insideBar] = InsideBar(i_NBars)
bullInsideBar=bar_index > 40 and insideBar and bullBar
and (i_BarsDirection ? contbullBar : true) and (i_MAFilter ? MAFilter : true)
bearInsideBar=bar_index > 40 and insideBar and bearBar
and (i_BarsDirection ? contbearBar : true) and (i_MAFilter ? not MAFilter : true)
BUY = bullInsideBar
SELL = bearInsideBar
//Debugging Plots
plot(contbullBar ? 1:0, transp=100, title="contbullBar")
plot(contbearBar ? 1:0, transp=100, title="contbearBar")
//Trading Inputs
DPR=input(true, "Allow Direct Position Reverse")
reverse=input(false, "Reverse Trades")
// Entries
if reverse
if not DPR
strategy.entry("long", strategy.long, when=SELL and strategy.position_size == 0)
strategy.entry("short", strategy.short, when=BUY and strategy.position_size == 0)
else
strategy.entry("long", strategy.long, when=SELL)
strategy.entry("short", strategy.short, when=BUY)
else
if not DPR
strategy.entry("long", strategy.long, when=BUY and strategy.position_size == 0)
strategy.entry("short", strategy.short, when=SELL and strategy.position_size == 0)
else
strategy.entry("long", strategy.long, when=BUY)
strategy.entry("short", strategy.short, when=SELL)
SL= i_SLType == "Swing Lo/Hi" ? entry_LL_price : i_SLType == "ATR Stop" ? LongSL_ATR_price : LongStop
SSL= i_SLType == "Swing Lo/Hi" ? entry_HH_price : i_SLType == "ATR Stop" ? ShortSL_ATR_price : ShortStop
TP= i_SLType == "Swing Lo/Hi" ? tp : i_SLType == "ATR Stop" ? ATRtp : StratTP
STP= i_SLType == "Swing Lo/Hi" ? stp : i_SLType == "ATR Stop" ? ATRstp : StratSTP
//TrailingStop
dif=(valuewhen(strategy.position_size>0 and strategy.position_size[1]<=0, high,0))
-strategy.position_avg_price
trailOffset = strategy.position_avg_price - SL
var tstop = float(na)
if strategy.position_size > 0
tstop := high- trailOffset - dif
if tstop<tstop[1]
tstop:=tstop[1]
else
tstop := na
StrailOffset = SSL - strategy.position_avg_price
var Ststop = float(na)
Sdif=strategy.position_avg_price-(valuewhen(strategy.position_size<0
and strategy.position_size[1]>=0, low,0))
if strategy.position_size < 0
Ststop := low+ StrailOffset + Sdif
if Ststop>Ststop[1]
Ststop:=Ststop[1]
else
Ststop := na
strategy.exit("TP & SL", "long", limit=TP, stop=TS? tstop : SL, when=i_SL)
strategy.exit("TP & SL", "short", limit=STP, stop=TS? Ststop : SSL, when=i_SL)
/////////////////////// PLOTS //////////////////////////////////////////////////
plot(i_SL and strategy.position_size > 0 and not TS ? SL : i_SL and strategy.position_size > 0 and TS ? tstop : na , title='SL', style=plot.style_cross, color=color.red)
plot(i_SL and strategy.position_size < 0 and not TS ? SSL : i_SL and strategy.position_size < 0 and TS ? Ststop : na , title='SSL', style=plot.style_cross, color=color.red)
plot(i_SL and strategy.position_size > 0 ? TP : na, title='TP', style=plot.style_cross, color=color.green)
plot(i_SL and strategy.position_size < 0 ? STP : na, title='STP', style=plot.style_cross, color=color.green)
// Draw price action setup arrows
plotshape(BUY ? 1 : na, style=shape.triangleup, location=location.belowbar,
color=color.green, title="Bullish Setup", size=size.auto)
plotshape(SELL ? 1 : na, style=shape.triangledown, location=location.abovebar,
color=color.red, title="Bearish Setup", size=size.auto)