Chiến lược theo xu hướng dựa trên mức dừng lỗ EMA và ATR

1
Follow
1779
Followers
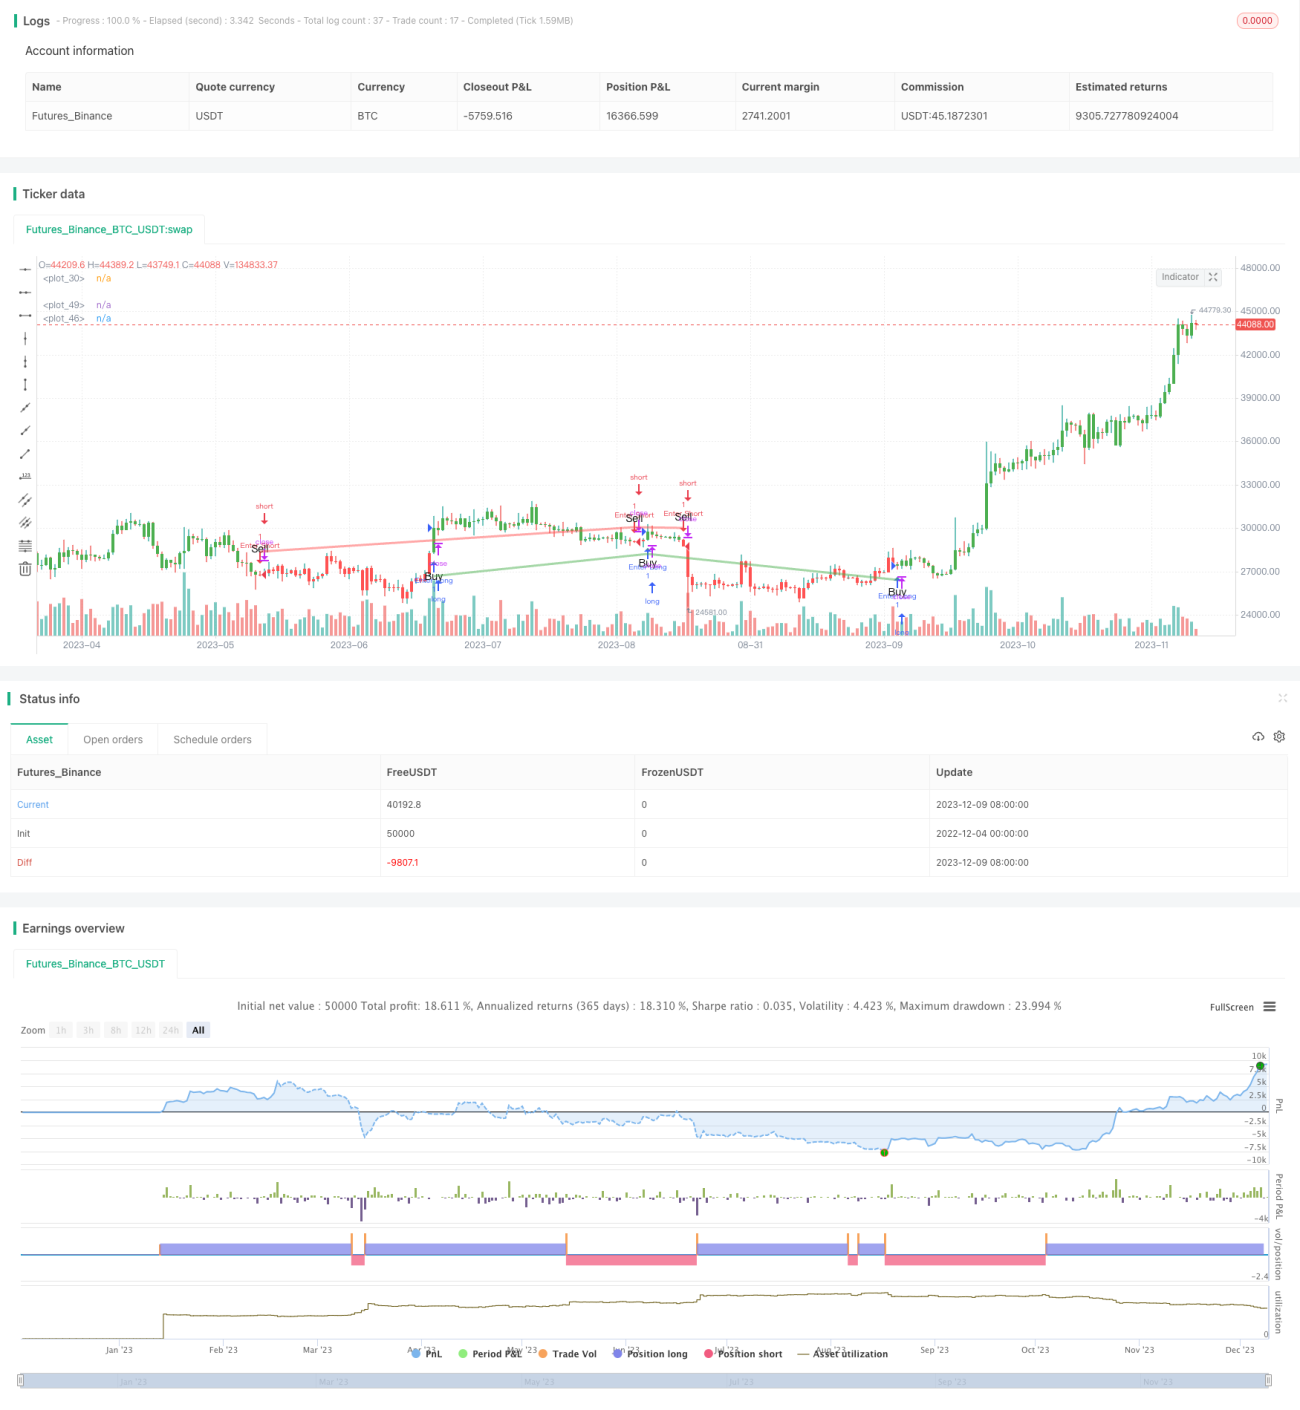
Tổng quan
Chiến lược này sử dụng đường EMA đồng bằng golden cross tạo ra tín hiệu giao dịch, tức là đường EMA nhanh tạo ra tín hiệu mua khi đi qua đường EMA chậm, đường EMA nhanh tạo ra tín hiệu bán khi đi qua đường EMA chậm, thuộc chiến lược theo dõi xu hướng điển hình. Đồng thời, chiến lược sử dụng chỉ số ATR để thiết lập điểm dừng động để kiểm soát rủi ro trong khi đảm bảo lợi nhuận.
Nguyên tắc chiến lược
- Định nghĩa chu kỳ trung bình EMA nhanh là 13, chu kỳ trung bình EMA chậm là 48.
- Khi đường EMA nhanh đi qua đường EMA chậm, nó tạo ra tín hiệu mua; khi đường EMA nhanh đi qua đường EMA chậm, nó tạo ra tín hiệu bán.
- Xác định đồng tuyến tạ tử tạ bằng các hàm ta.crossover và ta.crossunder.
- Sử dụng chỉ số ATR để tính toán điểm dừng động, điểm dừng là khoảng cách gần 1,5 lần ATR.
- Tín hiệu giao dịch và điểm dừng lỗ được hiển thị trực quan thông qua sự thay đổi màu sắc, dấu hiệu mua và bán và đường dừng lỗ.
Phân tích lợi thế chiến lược
- Mức giá vàng dựa trên đường trung bình EMA tạo ra tín hiệu, tránh bỏ lỡ xu hướng chính của thị trường và có lợi nhuận đáng kể.
- ATR động theo dõi dừng lỗ, đảm bảo lợi nhuận trọn vẹn và kiểm soát rủi ro rút tiền, lợi nhuận rủi ro tổng thể cân bằng.
- Hình hiển thị tín hiệu trực quan và hiển thị dừng, hoạt động đơn giản, phù hợp với hầu hết mọi người.
- Các tham số có thể điều chỉnh ít hơn, dễ nắm bắt và tối ưu hóa.
Phân tích rủi ro chiến lược
- Sự cố đột ngột có thể gây ra sự sụt giảm có thể gây ra thiệt hại.
- Các tín hiệu không hiệu quả có thể được tạo ra thường xuyên trong các cơn động đất.
- Thiết lập tham số không đúng có thể dẫn đến quá mạnh vào sân hoặc quá thoải mái.
- Cần tối ưu hóa các tham số EMA và tham số ATR.
Giải pháp:
- ATR có thể được nới lỏng một cách thích hợp để đảm bảo có một số đệm dừng lỗ so với mức cao gần nhất.
- Có thể xem xét có cơ chế xác nhận sau khi tín hiệu được tạo ra, chẳng hạn như mức cao trước khi giá phá vỡ.
- Chúng tôi đề xuất rằng việc tối ưu hóa tham số phải xem xét toàn bộ các tình huống thị trường khác nhau.
Hướng tối ưu hóa chiến lược
- Bạn có thể thử nghiệm các tổ hợp tham số khác nhau để tìm ra tham số tốt nhất.
- Có thể xem xét thêm các chỉ số khác để lọc tín hiệu, chẳng hạn như chỉ số khối lượng giao dịch, chỉ số tỷ lệ dao động, v.v., để cải thiện chất lượng tín hiệu.
- Các tham số EMA có thể được điều chỉnh theo xu hướng cấp độ lớn để nắm bắt được xu hướng chính.
- Bạn có thể xem xét động điều chỉnh ATR Stop Loss Coefficient, mở rộng phạm vi Stop Loss trong trường hợp xu hướng.
- Các tham số tối ưu hóa tự thích ứng có thể được kết hợp với thuật toán học máy.
Tóm tắt
Chiến lược này nói chung là đơn giản và dễ sử dụng, dựa trên đường trung bình EMA để tạo tín hiệu, và có thể kiểm soát rủi ro một cách hiệu quả. Mặc dù có một số tín hiệu giả, nhưng khả năng nắm bắt xu hướng chính mạnh mẽ, thu nhập ổn định hơn, phù hợp với một trong những chiến lược cơ bản của giao dịch định lượng.
Source
Pine
/*backtest
start: 2022-12-04 00:00:00
end: 2023-12-10 00:00:00
period: 1d
basePeriod: 1h
exchanges: [{"eid":"Futures_Binance","currency":"BTC_USDT"}]
*/

// This source code is subject to the terms of the Mozilla Public License 2.0 at https://mozilla.org/MPL/2.0/
// © byee322

/// This strategy uses the EMA to generate buy and sell signals with a 1.5x ATR stop lossStrategy parameters
Related strategies
Comment
All comments (0)
No data
- 1