Chiến lược giao dịch chỉ số mạnh mẽ theo băng tần kép
Ngày tạo:
2023-12-12 17:12:35
sửa đổi lần cuối:
2023-12-12 17:47:33
sao chép:
1
Số nhấp chuột:
1068
1
tập trung vào
1750
Người theo dõi
Tổng quan
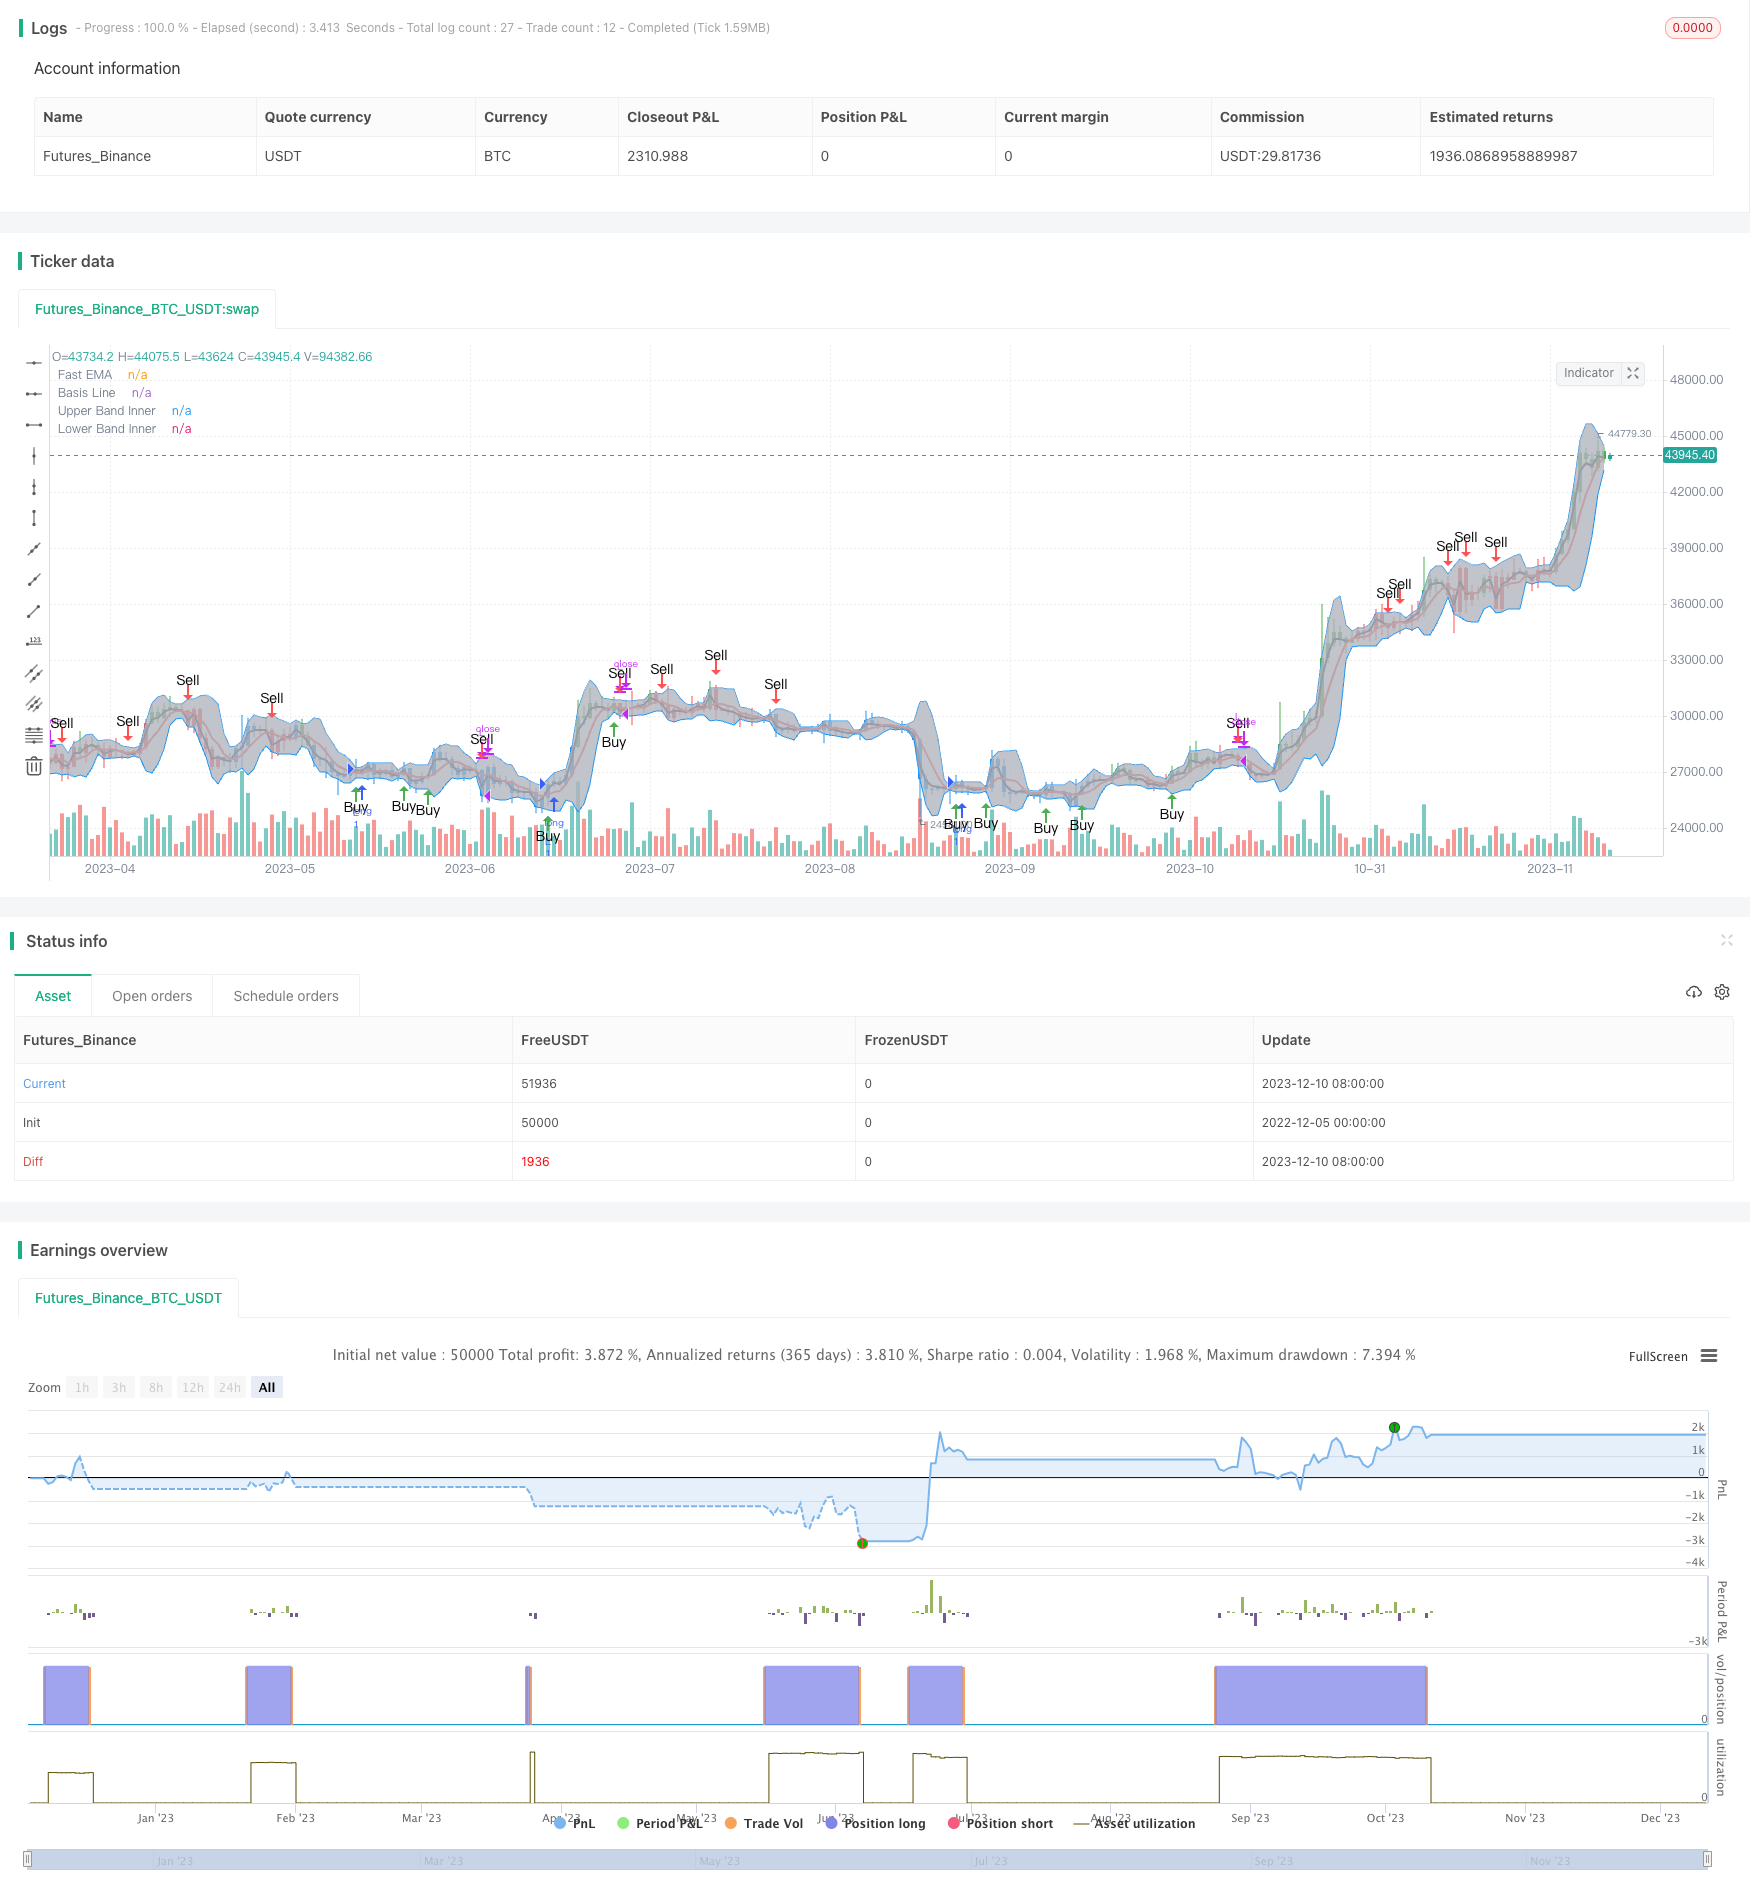
Chiến lược này kết hợp các chỉ số băng tần kép và chỉ số mạnh để thực hiện mô hình giao dịch đột phá. Khi EMA nhanh đột phá các kênh băng tần, kết hợp với tín hiệu đa chiều của chỉ số AO để tạo ra tín hiệu mua và bán.
Nguyên tắc chiến lược
- Sử dụng đường ray trung tâm, đường ray trên và đường ray dưới để xác định kênh giá.
- Khi EMA nhanh vượt qua quỹ đạo trung tâm, nó được coi là phá vỡ lối đi.
- Chỉ số sức mạnh AO chỉ định định hướng của đầu nhiều đầu và đầu trống.
- Một tín hiệu mua được tạo ra khi EMA nhanh vượt qua đường trung đạo và AO là chính xác.
- Một dấu hiệu bán ra được tạo ra khi EMA nhanh phá vỡ đường trung đạo xuống và AO là âm.
Phân tích lợi thế
- Chỉ số băng tần kép đánh giá kênh giá, tránh tín hiệu sai.
- Chỉ số AO đánh giá xu hướng, làm cho tín hiệu giao dịch chính xác hơn.
- Kết hợp với các mô hình giao dịch phá vỡ kênh, bạn có thể bắt được nhiều tiền hơn trong giai đoạn bắt đầu của xu hướng.
Phân tích rủi ro
- Các tham số Brin đai không đúng có thể dẫn đến lối đi quá rộng hoặc quá hẹp.
- Cài đặt tham số chỉ số AO có thể ảnh hưởng đến độ chính xác của phán đoán.
- Các tín hiệu đột phá có thể là đột phá giả, cần đảm bảo có đủ sức mạnh đột phá.
Giải pháp
- Tối ưu hóa các tham số của Brin và AO để tìm sự kết hợp tốt nhất.
- Tăng cường các điều kiện phá vỡ để tránh phá vỡ giả.
- Sử dụng kết hợp với các chỉ số khác để đảm bảo độ tin cậy của tín hiệu giao dịch.
Hướng tối ưu hóa
- Tối ưu hóa các tham số của Brin Belt để tìm phạm vi đường thông phù hợp nhất.
- Tối ưu hóa các tham số đường trung bình dài hạn của chỉ số AO, cải thiện độ chính xác phán đoán.
- Thêm bộ lọc volume hoặc các chỉ số khác để đảm bảo độ tin cậy của đột phá.
- Tối ưu hóa các tham số sức mạnh đột phá, giảm tỷ lệ đột phá giả.
Tóm tắt
Chiến lược tổng hợp này xem xét các kênh giá, hướng xu hướng và mô hình phá vỡ, là một chiến lược giao dịch ổn định và hiệu quả hơn. Bằng cách tối ưu hóa tham số và lọc các chỉ số kết hợp, bạn có thể tăng thêm sự ổn định và lợi nhuận của chiến lược. Mô hình giao dịch phá vỡ của nó có thể nắm bắt cơ hội sớm của xu hướng, có giá trị thực tế lớn.
Mã nguồn chiến lược
/*backtest
start: 2022-12-05 00:00:00
end: 2023-12-11 00:00:00
period: 1d
basePeriod: 1h
exchanges: [{"eid":"Futures_Binance","currency":"BTC_USDT"}]
*/

//@version=3

strategy(shorttitle="BB+AO STRAT", title="BB+AO STRAT", overlay=true)


// === BACKTEST RANGE ===
FromMonth = input(defval = 6, title = "From Month", minval = 1)
FromDay   = input(defval = 1, title = "From Day", minval = 1)
FromYear  = input(defval = 2018, title = "From Year", minval = 2014)
ToMonth   = input(defval = 1, title = "To Month", minval = 1)
ToDay     = input(defval = 1, title = "To Day", minval = 1)
ToYear    = input(defval = 9999, title = "To Year", minval = 2014)

// Bollinger Bands Inputs
bb_use_ema = input(false, title="Use EMA for Bollinger Band")
bb_length = input(5, minval=1, title="Bollinger Length")
bb_source = input(close, title="Bollinger Source")
bb_mult = input(2.0, title="Base Multiplier", minval=0.5, maxval=10)
// EMA inputs
fast_ma_len = input(2, title="Fast EMA length", minval=2)
// Awesome Inputs
nLengthSlow = input(34, minval=1, title="Awesome Length Slow")
nLengthFast = input(5, minval=1, title="Awesome Length Fast")


// Breakout Indicator Inputs
bb_basis = bb_use_ema ? ema(bb_source, bb_length) : sma(bb_source, bb_length)
fast_ma  = ema(bb_source, fast_ma_len)

// Deviation

dev = stdev(bb_source, bb_length)
bb_dev_inner = bb_mult * dev

// Upper bands
inner_high = bb_basis + bb_dev_inner
// Lower Bands
inner_low = bb_basis - bb_dev_inner

// Calculate Awesome Oscillator
xSMA1_hl2 = sma(hl2, nLengthFast)
xSMA2_hl2 = sma(hl2, nLengthSlow)
xSMA1_SMA2 = xSMA1_hl2 - xSMA2_hl2
// Calculate direction of AO
AO = xSMA1_SMA2>=0? xSMA1_SMA2 > xSMA1_SMA2[1] ? 1 : 2 : xSMA1_SMA2 > xSMA1_SMA2[1] ? -1 : -2


// === PLOTTING ===

// plot BB basis
plot(bb_basis, title="Basis Line", color=red, transp=10, linewidth=2)
// plot BB upper and lower bands
ubi = plot(inner_high, title="Upper Band Inner", color=blue, transp=10, linewidth=1)
lbi = plot(inner_low, title="Lower Band Inner", color=blue, transp=10, linewidth=1)
// center BB channel fill
fill(ubi, lbi, title="Center Channel Fill", color=silver, transp=90)

// plot fast ma
plot(fast_ma, title="Fast EMA", color=black, transp=10, linewidth=2)

// Calc breakouts
break_down =   crossunder(fast_ma, bb_basis) and close < bb_basis and abs(AO)==2
break_up   =  crossover(fast_ma, bb_basis) and close > bb_basis and abs(AO)==1

// Show Break Alerts
plotshape(break_down, title="Breakout Down", style=shape.arrowdown, location=location.abovebar, size=size.auto, text="Sell", color=red, transp=0)
plotshape(break_up, title="Breakout Up", style=shape.arrowup, location=location.belowbar, size=size.auto, text="Buy", color=green, transp=0)
// === ALERTS ===


strategy.entry("L", strategy.long, when=(break_up and (time > timestamp(FromYear, FromMonth, FromDay, 00, 00)) and (time < timestamp(ToYear, ToMonth, ToDay, 23, 59))))


strategy.close("L", when=(break_down and (time < timestamp(ToYear, ToMonth, ToDay, 23, 59))))

// === /PLOTTING ===
barcolor(AO == 2 ? red: AO == 1 ? green : blue )


// eof