Chiến lược chỉ báo động lượng RSI/MFI dựa trên lý thuyết Dow

1
Follow
1779
Followers
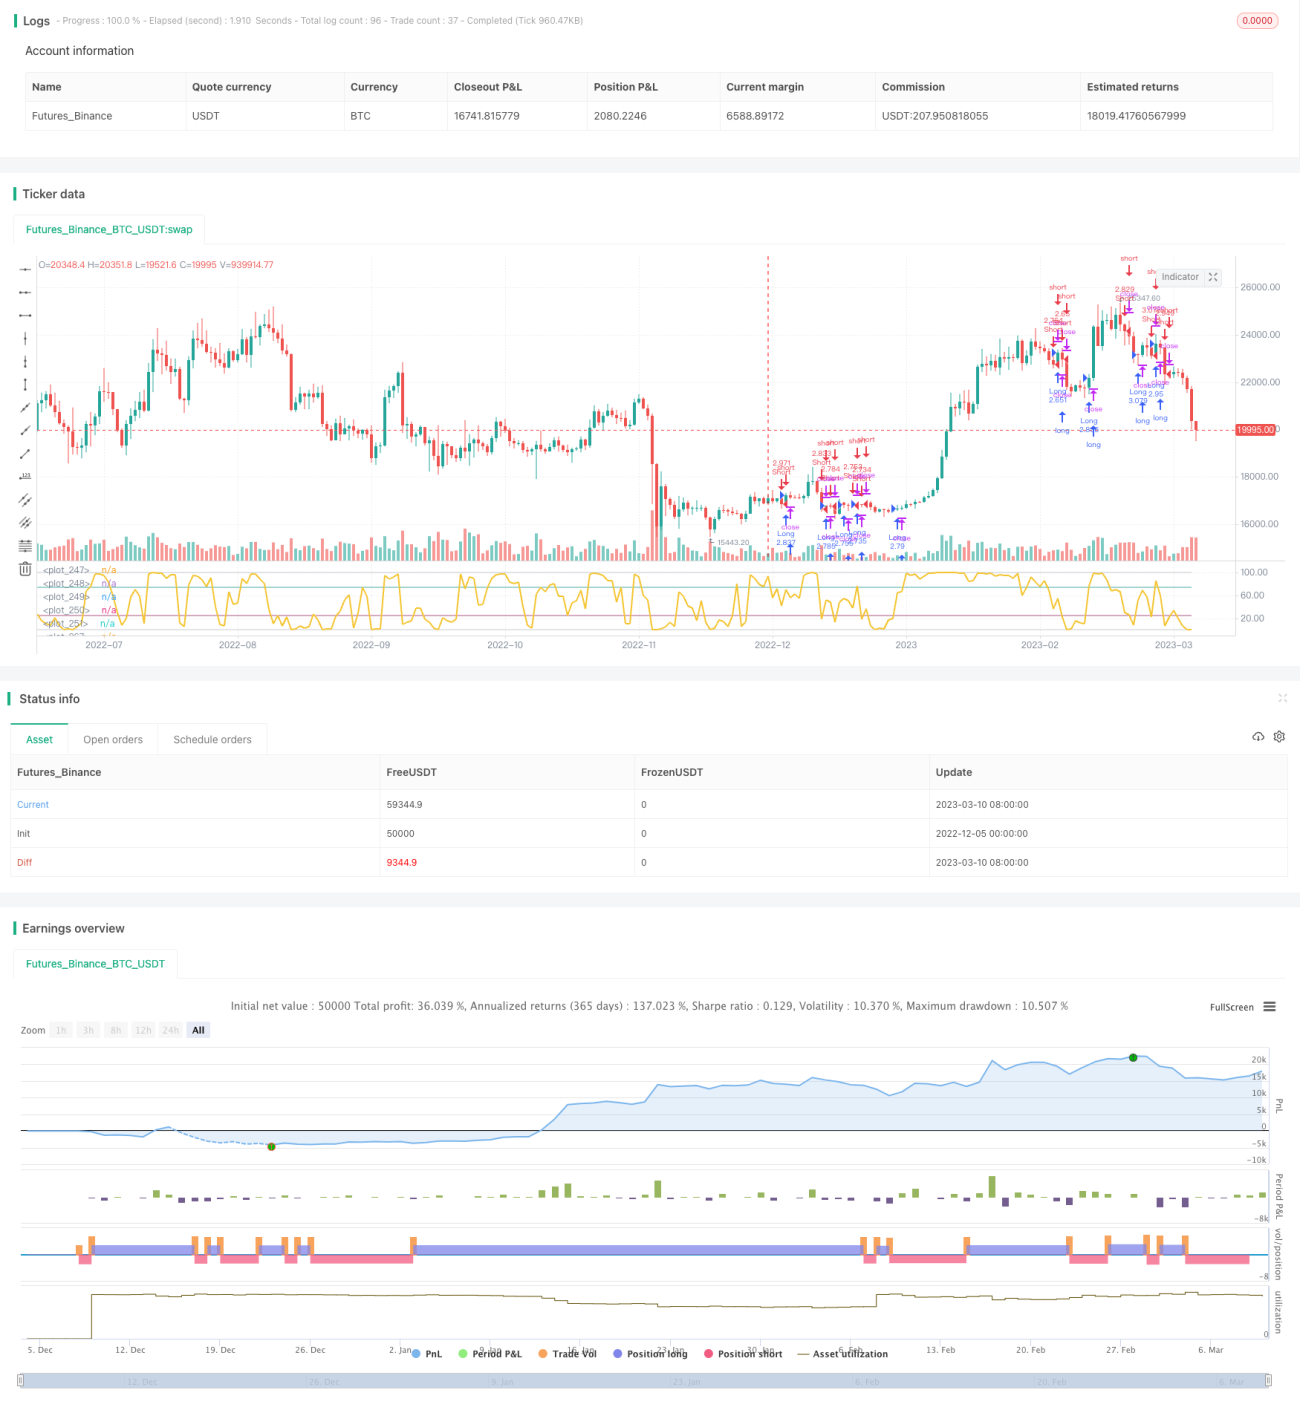
Tổng quan
Chiến lược này sử dụng chỉ số tương đối mạnh yếu (RSI) hoặc chỉ số dòng tiền (MFI) để xác định thị trường tăng hoặc giảm, và kết hợp hệ số bò và gấu của lý thuyết Dow để tính toán phân bố xác suất điều chỉnh. Tùy thuộc vào loại thị trường khác nhau, các logic nhập và thoát khác nhau được sử dụng.
Nguyên tắc chiến lược
- Tính toán RSI hoặc MFI để xác định thị trường hiện tại là gì (bull hoặc bear)
- Tính toán hệ số bò và gấu theo thuyết Dow để phản ánh sự liên quan giữa giá hiện tại và khối lượng giao dịch
- Điều chỉnh phân phối xác suất RSI/MFI để xác định phân phối đa không gian chính xác
- Xác định xem có được vào không dựa trên SessionId hiện tại và xác suất
- Khi lợi nhuận bị thu hồi hoặc thị trường bị thu hẹp
Phân tích lợi thế
- Kết hợp với lý thuyết Dao, phân loại thị trường chính xác hơn
- Ghi lại các yếu tố để tránh nhập học mù quáng
- Tỷ lệ lợi nhuận cao, thu hồi thấp
Phân tích rủi ro
- Các tham số không đúng lúc sẽ gây ra nhiều sai lầm.
- Cần có đủ dữ liệu lịch sử
- Logic dừng lỗ đơn giản, không thể tối ưu hóa cho các trường hợp đặc biệt
Hướng tối ưu hóa
- Có thể xem xét kết hợp các chỉ số khác để đánh giá market session
- Thêm logic dừng lỗ nghiêm ngặt hơn dựa trên biến động, dữ liệu lịch sử, v.v.
- Bạn có thể thử học máy để xác định các tham số tốt hơn
Tóm tắt
Chiến lược này nói chung có kết quả tốt và có một số giá trị thực tế. Tuy nhiên, vẫn cần thử nghiệm và điều chỉnh thêm, đặc biệt là logic dừng tổn thất. Sử dụng các chỉ số hỗ trợ phán đoán sẽ hiệu quả hơn, không thể theo dõi mù quáng.
Source
Pine
Strategy parameters
Related strategies
Comment
All comments (0)
No data
- 1