Chiến lược chỉ báo Dynamic Traders Index
Tổng quan
Chiến lược này dựa trên chỉ số nhà giao dịch năng động (TDI) và chỉ số kênh hành động giá (PAC), kết hợp với kênh Brin, chỉ số tương đối mạnh (RSI) và chỉ số MACD để thực hiện một hệ thống theo dõi xu hướng.
Chiến lược này chủ yếu được sử dụng để phát hiện xu hướng và tạo ra tín hiệu giao dịch khi có sự thay đổi lớn về hướng xu hướng. Nó kết hợp nhiều chỉ số nhằm cải thiện tỷ lệ phát hiện và chất lượng tín hiệu.
Nguyên tắc chiến lược
Trung tâm của chiến lược này là chỉ số TDI. TDI bao gồm nhiều chỉ số con chồng lên nhau, bao gồm:
- Chỉ số tương đối mạnh (RSI): mức độ mạnh của giá phản ứng
- Brin Belt: Phạm vi biến động giá phản ứng
- Đường giá RSI: Đường trung bình di chuyển đơn giản của RSI phản ứng với xu hướng giá của RSI
- Đường tín hiệu giao dịch RSI: Một đường trung bình di chuyển đơn giản khác của RSI được sử dụng để tạo tín hiệu giao dịch
Đường giao dịch cũng sẽ tạo ra tín hiệu yếu hơn khi đường giao dịch đi qua đường trung tâm.
Ngoài ra, chiến lược này cũng kết hợp với chỉ số hành động của kênh giá. Chỉ số này dựa trên giá cao nhất, giá thấp nhất trong khoảng thời gian để tính toán kênh giá.
Để lọc thông báo sai, chiến lược cũng đưa ra chỉ số MACD. Chỉ khi màu cột MACD phù hợp với hướng tín hiệu giao dịch, tín hiệu nhập cảnh sẽ được kích hoạt.
Lợi thế chiến lược
Chiến lược này kết hợp các lợi thế của nhiều chỉ số so với chỉ số đơn lẻ:
- Chỉ số TDI nhạy cảm hơn với sự thay đổi xu hướng
- Đường hành động của giá phản ánh rõ ràng sự hỗ trợ và áp lực
- MACD có thể lọc thông báo sai
Ngoài ra, so với các chỉ số theo dõi xu hướng như đường trung bình di chuyển, TDI nhạy cảm hơn với sự đảo ngược xu hướng và có thể giảm tổn thất không cần thiết.
Chiến lược này cũng có thể được điều chỉnh thông qua các tham số để thích ứng với các môi trường thị trường khác nhau.
Rủi ro chiến lược
- Nhiều chỉ số chồng lên nhau, điều chỉnh tham số phức tạp
- Tần suất giao dịch có thể quá cao, làm tăng chi phí giao dịch và rủi ro trượt
- Nhận dạng ngược không chính xác 100%, có thể bỏ lỡ xu hướng giá tiếp tục chạy theo một hướng
- Sự thay đổi giá trong giao dịch trên thực tế phức tạp hơn so với phản hồi, hiệu quả tín hiệu khó có thể sao chép
Có thể giảm tổn thất đơn lẻ bằng cách mở rộng mức dừng. Cải thiện chất lượng tín hiệu bằng cách tối ưu hóa các tham số. Giảm tần suất giao dịch bằng cách mở rộng các điều kiện tham gia thích hợp.
Hướng tối ưu hóa
- Điều chỉnh các tham số TDI để tìm sự kết hợp tốt nhất
- Điều chỉnh chiều dài hành động giá, tối ưu hóa nhận diện kháng cự hỗ trợ
- Điều chỉnh các tham số MACD để tối ưu hóa hiệu quả lọc nhập
- Thêm quản lý vị trí và di chuyển chiến lược dừng lỗ
Tóm tắt
Chiến lược này sử dụng nhiều chỉ số để đánh giá xu hướng và cơ hội đảo ngược. Nó có thể được điều chỉnh theo các tham số để thích nghi với các giống khác nhau. Có một số giá trị thực tế, nhưng hiệu quả tín hiệu gần như hoàn hảo vẫn có một số khó khăn.
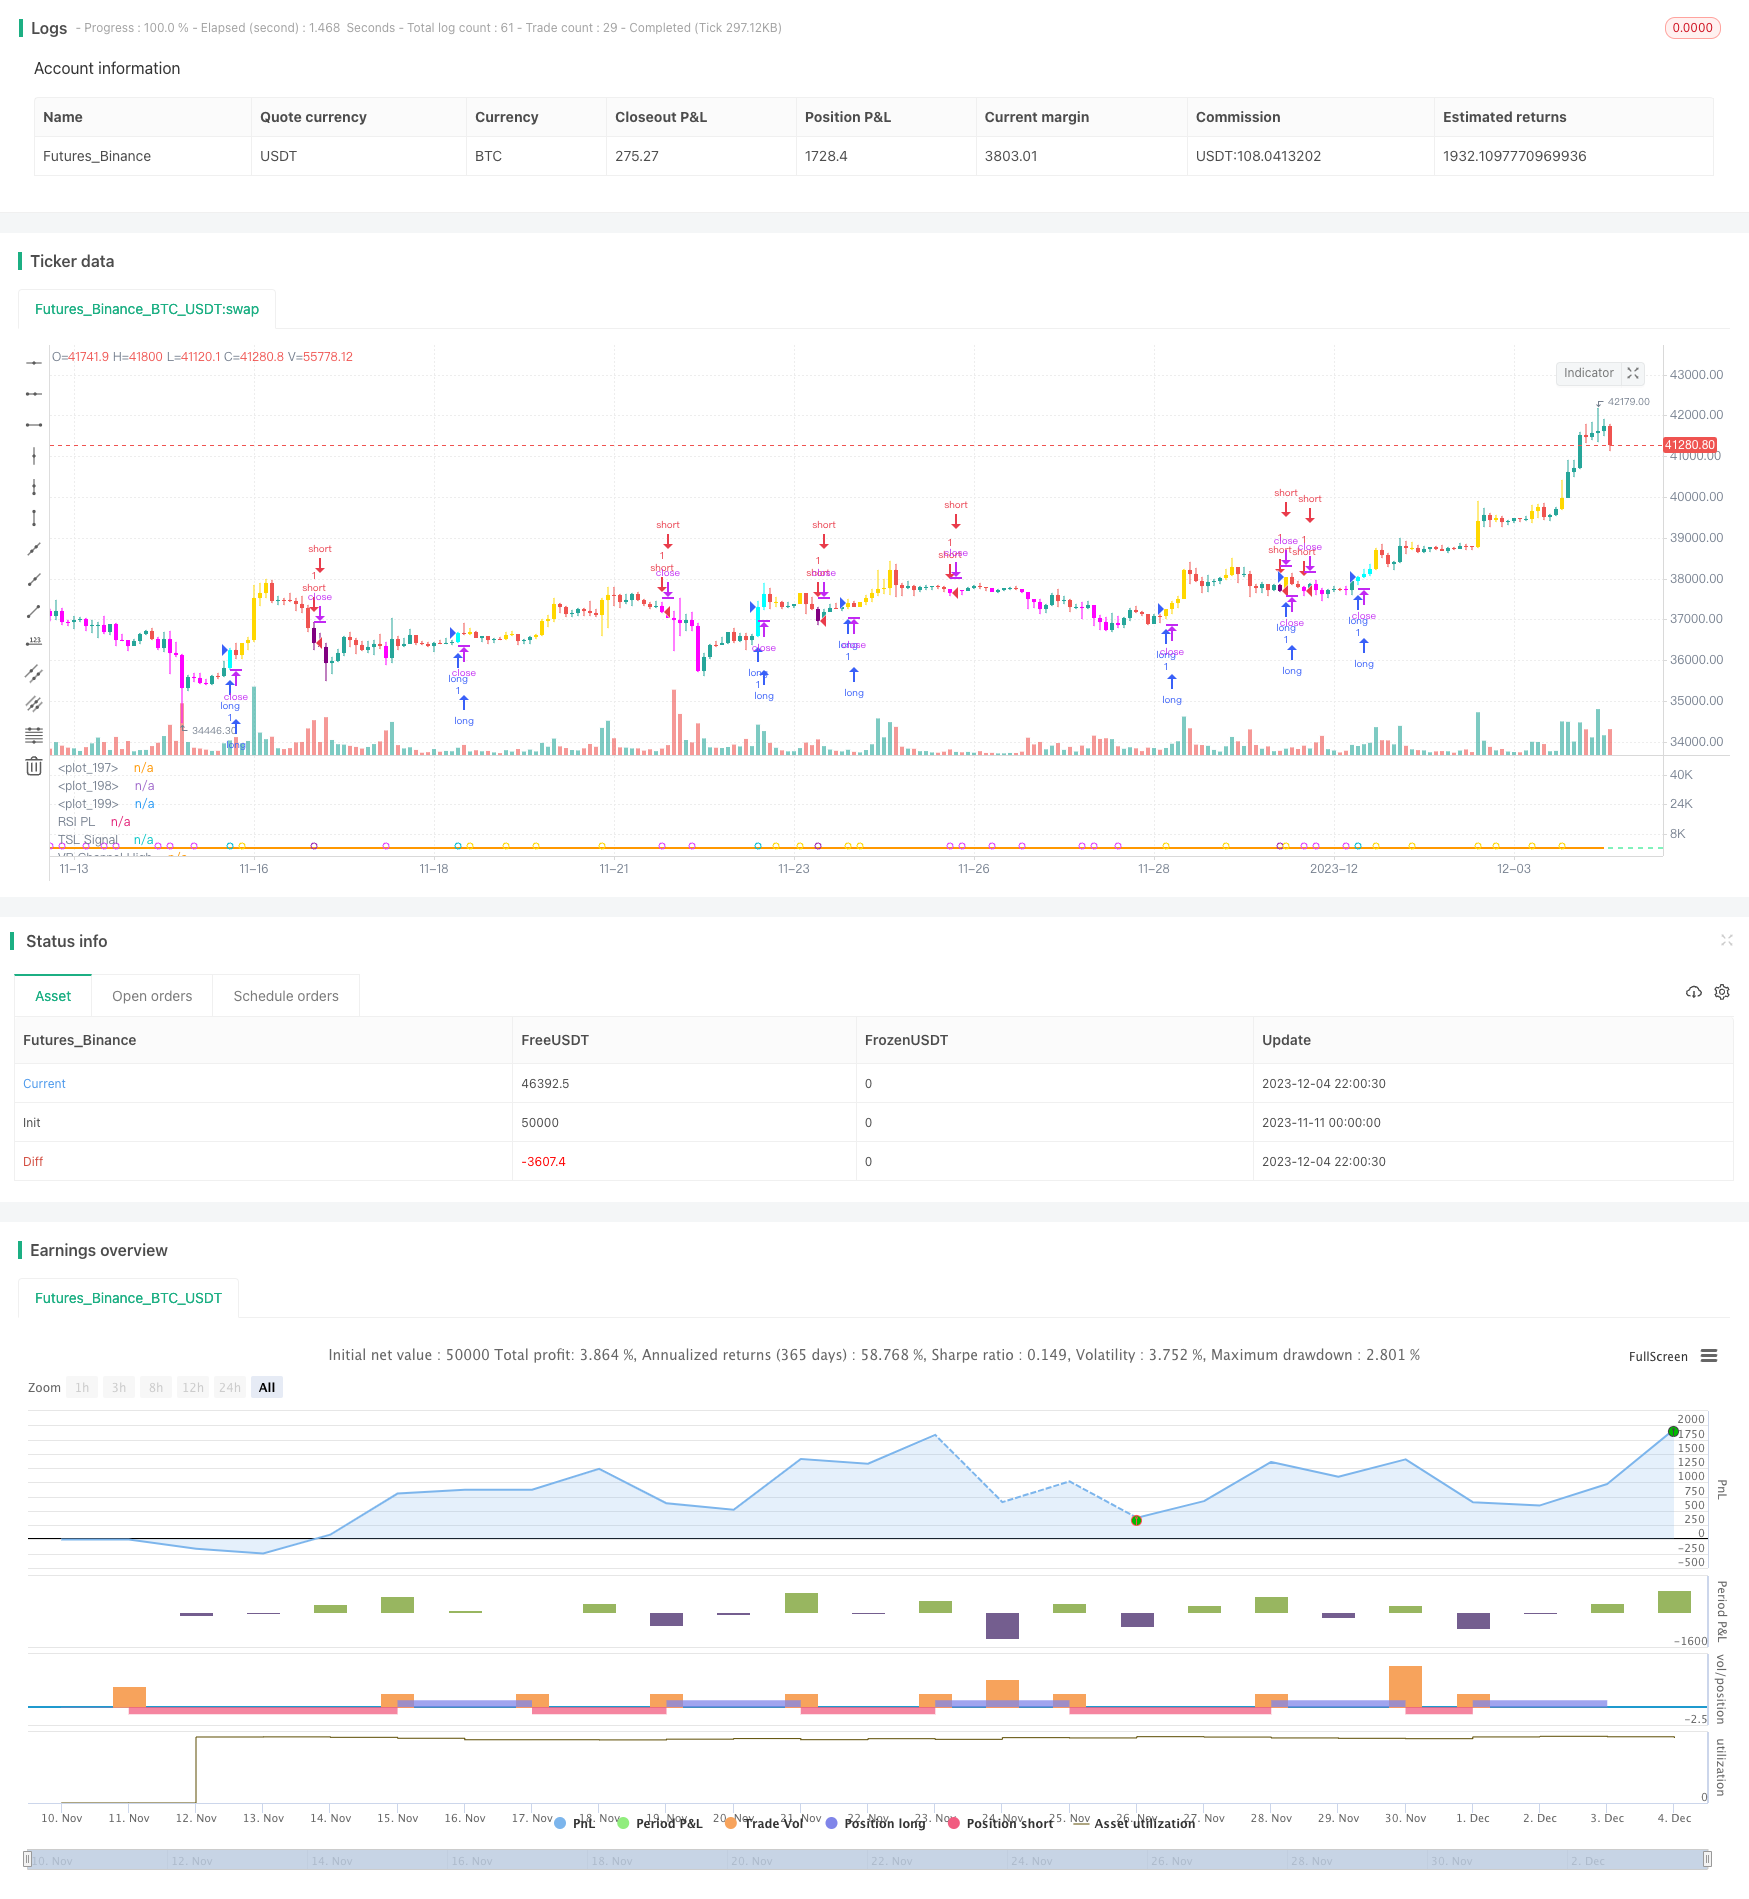
/*backtest
start: 2023-11-11 00:00:00
end: 2023-12-05 00:00:00
period: 2h
basePeriod: 15m
exchanges: [{"eid":"Futures_Binance","currency":"BTC_USDT"}]
*/

//@version=4
//

strategy("[BACKTEST]Traders Dynamic Index Indicator Alert by JustUncleL", shorttitle="[BACKTEST]TDIALT")

//
// author: JustUncleL
// date: 10-Oct-2019
//
// Description:
//   This script is a "strategy" version of the "Traders Dynamic Index Indicator Alert v0.1 by JustUncleL"
//   made available for backtesting to help optimize settings.
//
//   This is a Trend following system utilising the Traders Dynamic Index (TDI),
//   Price Action Channel (PAC) and Heikin Ashi candles.
//   About while ago I came across the use of TDI in "E.A.S.Y. Method" that I found in
//   forexfactory forums: http://www.forexfactory.com/attachment.php?attachmentid=686629&d=1303831008
//   and I was able to set up a chart based on the specifications by using Kurbelklaus scripts.
//   However, I found that the alerts were being generated one or two bars too late,
//   so I was not successful using it with Binary Options. Later I found a variation of the
//   method in the forums which generates alerts a bit earlier, so this indicator is a
//   variation of that early detection version.
//   The indicator can optionally use Heikin  Ashi candles only for all it's calculations,
//   I would recommend viewing the chart with normal Heikin Ashi candles, these
//   smooth out the trends and makes them more visible.
//
//   I found that this metod it works OK with currency pairs or commodities.
//   It also seems to work well with 5min+ timeframe charts,
//   and for Binary Options I would suggest expiry of 2 to 6 candles.
//
//   ALERT GENERATION:
//   =================
//
//   The TDI (Traders Dynamic Index)
//   -------------------------------
//   Volatility Band VB(34), color: Blue, buffer: UpZone, DnZone
//   Relative Strength Index RSI(13)
//   RSI PRICE LINE (2), color: Green, buffer: mab
//   RSI TRADE SIGNAL LINE (7), color: Red, buffer: mbb
//   MARKET BASE LINE MID VB(34), color: Orange, buffer: mid
//
//   Indicator SignalLevels:
//   -----------------------
//   RSI_OversoldLevel : 22 (normally: 32)
//   RSI_OverboughtLevel : 78 (normally: 68)
//
//   Alert Conditions:
//   -----------------
//   Strong Buy (yellow): HIGH>PAC upper && BULL Candle && Candle High>PAC High && RSI>TRADE SIGNAL LINE && RSI>RSI_OversoldLevel &&
//                        && RSI<RSI_OverboughtLevel && TRADE SIGNAL LINE> MARKET BASE LINE
//   Medium Buy (aqua): HIGH>PAC upper && BULL Candle && Candle High>PAC High && RSI>TRADE SIGNAL LINE && RSI>RSI_OversoldLevel
//                        && RSI<RSI_OverboughtLevel && RSI> MARKET BASE LINE && TRADE SIGNAL LINE< MARKET BASE LINE
//   Weak Buy (blue):   HIGH>PAC upper && BULL Candle && Candle High>PAC High && RSI>TRADE SIGNAL LINE && RSI>RSI_OversoldLevel
//                        && RSI<RSI_OverboughtLevel && TRADE SIGNAL LINE<MARKET BASE LINE && RSI< MARKET BASE LINE
//
//   Strong Sell (fuchsia): LOW<PAC lower && BEAR Candle && Candle Low>PAC Low && RSI<TRADE SIGNAL LINE && RSI>RSI_OversoldLevel
//                        && RSI<RSI_OverboughtLevel && TRADE SIGNAL LINE< MARKET BASE LINE
//   Medium Sell (purple): LOW<PAC lower && BEAR Candle && Candle Low>PAC Low && RSI<TRADE SIGNAL LINE && RSI>RSI_OversoldLevel
//                           && RSI<RSI_OverboughtLevel && RSI< MARKET BASE LINE && TRADE SIGNAL LINE> MARKET BASE LINE
//   Weak Sell (black): LOW<PAC lower && BEAR Candle && Candle Low>PAC Low && RSI<TRADE SIGNAL LINE && RSI>RSI_OversoldLevel
//                        && RSI<RSI_OverboughtLevel && TRADE SIGNAL LINE> MARKET BASE LINE && RSI> MARKET BASE LINE
//
//   HIGH LEVEL FILTER (Overbought): RSI>=RSI_OverboughtLevel or MACD Histogram not green
//   LOW LEVEL FILTER (Oversold): RSI<=RSI_OversoldLevel or MACD Histogram not red
//
//   Hints on How to use:
//   --------------------
//   - When a Medium or Strong alert is generated and MACD histogram colour matches the direction
//     of the alert, then place trade in direction of alert candle and MACD.
//   - Use the multi-Hull MA's for trend direction confirmation.
//   - Best positions occur near the MACD(8,16,1) Histogram crossing the zero line.
//   - The optional coloured Dots along the bottom of the indicator represent the first alert
//     of this type that was generated in this sequence.
//   - It is advisable to trade in the direction of the main trend as indicated the HULL MA red cloud:
//     if red cloud underneath PAC then BULLISH trend, if red cloud above PAC then BEARISH trend.
//   - Selecting the HeiKin Ashi candles does affect the MACD and MA caculations, so if you select
//     normal candles the result chart will change. Although the TDI calculations and alerts will stay the
//     same.
//   - When using the Heikin Ashi candles, a good buy entry is indicated by long top wick and no bottom wick
//     for bull (green) candles and good sell entry is indicated by long bottom wick and no top wick for
//     bear (red) candles.
//   - When the MACD histogram is flat and close to zero line,
//     this indicates a ranging market, do NOT trade when this occurs.
//   - When the PAC channel on the main chart is spread apart widely, this is an indication
//     of extreme volitity and choppy chart, do NOT try to trade during these periods.
//     A choppy chart is also indicated by Heikin Ashi candles with long wicks on both sides
//     of the candles.
//   - You can specify what strength level Alerts are generated (default 2):
//     Level (1) means only generate Strong Alerts only.
//     Level (2) means generate Strong and Medium Alerts.
//     Level (3) means generate Strong, Medium and Weak Alerts.
//
//   Modifications:
//   --------------
//     11-Oct-2019
//          - Strategy Version for backtesting created.
//          - Converted to Pinescript V4
//
//     1.3  7-Aug-2017
//          - Modified Alertcondition code so that it only signals on the last completed alerted
//            candle. This should prevent some false alerts and multiple alerts being generated.
//            When setting alarms I suggest using Frequency "Once per bar (on condition)" to get
//            the earliest signal possible.
//          - Added optional alert long/short spikes that only occur on the first Long or Short//      Original code @author LazyBear for basic TDI indicator.

//            signals.
//     1.2  5-Aug-2017:
//          - Added new alerts for Buy and Sell (Long and Short) signals seperately.
//          - Upgraded to version 3 Pinescript.
//          - Added work around patch for opaque bar colouring issue.
//
//     1.1  - Modified code so when viewing Top chart with Heikin Ashi candles, calculations
//            are still based on standard candles, unless Heikin Ashi calculation option selected.
//
//     0.2  - Simplified MACD direction calculation to use just rising/falling.
//     0.1  - Oroginal Version
//   References:
//   -----------
//      Traders Dynamic Index [LazyBear]
//      KK_Traders Dynamic Index_Bar Highlighting by Kurbelklaus
//      KK_Price Action Channel (TDI BH) by Kurbelklaus
//      http://www.forexfactory.com/attachment.php?attachmentid=686629&d=1303831008
//      http://www.forexstrategiesresources.com/trading-system-metatrader-4-iv/504-traders-dynamic-index-how-to-use/
//      http://www.forexfactory.com/showthread.php?t=460148
//      http://www.forexstrategiesresources.com/scalping-forex-strategies-ii/205-scalping-with-tdi-real-macd-stochrainbow/
//
// -----------------------------------------------------------------------------
// Copyright 2016, 2017, 2019 JustUncleL
//
// This program is free software: you can redistribute it and/or modify
// it under the terms of the GNU General Public License as published by
// the Free Software Foundation, either version 3 of the License, or
// any later version.
//
// This program is distributed in the hope that it will be useful,
// but WITHOUT ANY WARRANTY; without even the implied warranty of
// MERCHANTABILITY or FITNESS FOR A PARTICULAR PURPOSE.  See the
// GNU General Public License for more details.
//
// The GNU General Public License can be found here
// <http://www.gnu.org/licenses/>.
//
// -----------------------------------------------------------------------------
//

//
lengthrsi = input(13)
lengthband = input(34)
lengthrsipl = input(2)
lengthtradesl = input(7)
lenH = input(5, minval=1, title="Price Action Channel Length")
lenL = lenH
rsiOSL = input(22, minval=0, maxval=49, title="RSI Oversold Level")
rsiOBL = input(78, minval=51, maxval=100, title="RSI Overbought Level")
strength = input(2, minval=1, maxval=3, step=1, title="Strength Level: (1)Strong (2)Medium (3)All")
sgb = input(false, title="Check Box To Turn Bars Gray")
sbr = input(true, title="Highlight TDI Alert Bars")
sal = input(true, title="Show Alert Condition Status")
uha = input(false, title="Use Heikin Ashi Candles for Calculations")
//

// Constants colours that include fully non-transparent option.
blue100 = #0000FFFF
aqua100 = #00FFFFFF
fuchsia100 = #FF00FFFF
purple100 = #800080FF
gray100 = #808080FF
gold100 = #FFD700FF
white100 = #FFFFFFFF
black100 = #000000FF
gold = #FFD700


// Use only Heikinashi Candles for all calculations or use Standard Candles for calculations.
security_1 = security(heikinashi(syminfo.tickerid), timeframe.period, close)
security_2 = security(syminfo.ticker, timeframe.period, close)
srcClose = uha ? security_1 : security_2
security_3 = security(heikinashi(syminfo.tickerid), timeframe.period, open)
security_4 = security(syminfo.ticker, timeframe.period, open)
srcOpen = uha ? security_3 : security_4
security_5 = security(heikinashi(syminfo.tickerid), timeframe.period, high)
security_6 = security(syminfo.ticker, timeframe.period, high)
srcHigh = uha ? security_5 : security_6
security_7 = security(heikinashi(syminfo.tickerid), timeframe.period, low)
security_8 = security(syminfo.ticker, timeframe.period, low)
srcLow = uha ? security_7 : security_8
//
r = rsi(srcClose, lengthrsi)
ma = sma(r, lengthband)
offs = 1.6185 * stdev(r, lengthband)
upZone = ma + offs
dnZone = ma - offs
mid = (upZone + dnZone) / 2
mab = sma(r, lengthrsipl)
mbb = sma(r, lengthtradesl)
//
hline(rsiOSL, color=color.red, linewidth=1)
hline(50, color=color.black, linewidth=1)
hline(rsiOBL, color=color.lime, linewidth=1)
// Plot the TDI
upl = plot(upZone, color=color.blue, title="VB Channel High", linewidth=2)
dnl = plot(dnZone, color=color.blue, title="VB Channel Low", linewidth=2)
midl = plot(mid, color=color.orange, linewidth=2, title="MBL")
mabl = plot(mab, color=color.green, linewidth=2, title="RSI PL")
mbbl = plot(mbb, color=color.red, linewidth=2, title="TSL Signal")
//
//create RSI TSL cloud to indicate trend direction.
fill(mabl, mbbl, color=mab > mbb ? color.green : color.red, transp=90)

// Calculate Price Action Channel (PAC)
smmaH = 0.0
smmaL = 0.0
sma_1 = sma(srcHigh, lenH)
smmaH := na(smmaH[1]) ? sma_1 : (smmaH[1] * (lenH - 1) + srcHigh) / lenH
sma_2 = sma(srcLow, lenL)
smmaL := na(smmaL[1]) ? sma_2 : (smmaL[1] * (lenL - 1) + srcLow) / lenL
//
umacd = input(false, title="Use MACD Filtering")
fastMA = input(title="MACD Fast MA Length", type=input.integer, defval=8, minval=2)
slowMA = input(title="MACD Slow MA Length", type=input.integer, defval=16, minval=7)
signal = input(title="MACD Signal Length", type=input.integer, defval=1, minval=1)
//
//
[currMacd, _, _] = macd(srcClose[0], fastMA, slowMA, signal)
rising_1 = rising(currMacd, 2)
falling_1 = falling(currMacd, 2)
macdH = currMacd > 0 ? rising_1 ? color.green : color.red :
   falling_1 ? color.red : color.green

//
// Bar - Highlighting  based on indication strength
long = (not umacd or macdH == color.green) and mab > mbb and mab < rsiOBL and
   mab > rsiOSL and srcHigh > smmaH and srcClose > srcOpen ?
   mbb > mid ? 1 : mab > mid and mbb < mid ? 2 : mab < mid and mbb < mid ? 3 : 0 : 0
short = (not umacd or macdH == color.red) and mab < mbb and mab < rsiOBL and
   mab > rsiOSL and srcLow < smmaL and srcClose < srcOpen ?
   mbb < mid ? 1 : mab < mid and mbb > mid ? 2 : mab > mid and mbb > mid ? 3 : 0 : 0
//
// Find the right Bar colour if enabled.
bcolor = not sbr ? na : long == 1 ? gold100 :
   long == 2 and strength > 1 ? aqua100 : long == 3 and strength > 2 ? blue100 :
   short == 1 ? fuchsia100 : short == 2 and strength > 1 ? purple100 :
   short == 3 and strength > 2 ? black100 : sgb ? gray100 : na
//
barcolor(color=bcolor, title="Bars Colours")
//
//
// === ALERT conditions
//
// create alerts only once per sequence type.
//
longCond = long > 0 and long != long[1] and long <= strength
shortCond = short > 0 and short != short[1] and short <= strength

// show dot only when alert condition is met and bar closed.
plotshape(sal and (longCond[1] or shortCond[1]), title="Alert Indicator", location=location.bottom,
          color=long[1] == 1 ? gold : long[1] == 2 ? color.aqua : long[1] == 3 ? color.blue : short[1] == 1 ? color.fuchsia : short[1] == 2 ? color.purple : short[1] == 3 ? color.black : na,
          transp=0, style=shape.circle, offset=-1)
//

// === /ALERT conditions.

// === STRATEGY ===
tradeType = input("BOTH", title="What trades should be taken : ", options=["LONG", "SHORT", "BOTH", "NONE"])

// stop loss
slPoints = input(defval=0, title="Initial Stop Loss Points (zero to disable)", minval=0)
tpPoints = input(defval=0, title="Initial Target Profit Points (zero for disable)", minval=0)

//>>>>>>>>>>>>>>>>>>>>>>>>>>>>>>>>>>>>>>>>>>>>>>>>>>>>>>>>>>>>>>>>>>>>>>>>>>>>>//

testStartYear = input(2018, "Backtest Start Year", minval=1980)
testStartMonth = input(1, "Backtest Start Month", minval=1, maxval=12)
testStartDay = input(1, "Backtest Start Day", minval=1, maxval=31)
testPeriodStart = timestamp(testStartYear, testStartMonth, testStartDay, 0, 0)

testStopYear = input(9999, "Backtest Stop Year", minval=1980)
testStopMonth = input(12, "Backtest Stop Month", minval=1, maxval=12)
testStopDay = input(31, "Backtest Stop Day", minval=1, maxval=31)
testPeriodStop = timestamp(testStopYear, testStopMonth, testStopDay, 0, 0)

testPeriod() =>
    time >= testPeriodStart and time <= testPeriodStop ? true : false

//<<<<<<<<<<<<<<<<<<<<<<<<<<<<<<<<<<<<<<<<<<<<<<<<<<<<<<<<<<<<<<<<<<<<<<<<<<<<<//

//
//set up exit parameters
TP = tpPoints > 0 ? tpPoints : na
SL = slPoints > 0 ? slPoints : na

// Make sure we are within the bar range, Set up entries and exit conditions
if testPeriod() and tradeType != "NONE"
    strategy.entry("long", strategy.long, when=longCond == true and tradeType != "SHORT")
    strategy.entry("short", strategy.short, when=shortCond == true and tradeType != "LONG")
    strategy.close("long", when=shortCond == true and tradeType == "LONG")
    strategy.close("short", when=longCond == true and tradeType == "SHORT")
    strategy.exit("XL", from_entry="long", profit=TP, loss=SL)
    strategy.exit("XS", from_entry="short", profit=TP, loss=SL)

// === /STRATEGY ===
//EOF