
Chiến lược điểm giao điểm hai đường cong là một chiến lược giao dịch định lượng dựa trên đường trung bình di chuyển. Nó xác định xu hướng giá bằng cách tính toán đường cong nhanh và đường cong, và phát ra tín hiệu mua và bán tại các điểm giao. Chiến lược này sử dụng đường cong Hull làm đường cong nhanh và bộ lọc Super Smoother làm đường cong.
Công thức tính toán của chiến lược điểm giao nhau hai đường đều như sau:
Đường nhanh ((Hull Average): WMA ((2 * WMA ((value,n/2) - WMA ((value,n),SQRT ((n))
Super Smoother: giá trị bộ lọc ba lần
Trong đó, WMA là trung bình di chuyển trọng lượng, SQRT là căn vuông mở, và bộ lọc chứa một trễ một cấp và hai trễ hai cấp.
Chiến lược này được đánh giá bằng cách tính các giá trị đường nhanh và đường chậm để xác định mối quan hệ chéo giữa hai đường, trong đó:
Đường dây nhanh là tín hiệu mua
Dưới đường nhanh, qua đường chậm là tín hiệu bán hàng.
Chiến lược giao điểm chéo hai đường đồng bằng kết hợp các lợi thế của phán đoán hai đường đồng bằng và giao dịch điểm, có thể nắm bắt chính xác các điểm chuyển hướng, vào và ra sân kịp thời. So với chiến lược đường đồng bằng đơn lẻ, nó có những lợi thế sau:
Tuy nhiên, chiến lược giao điểm hai đường đều có một số rủi ro:
Chiến lược điểm giao nhau hai đường đều có thể được tối ưu hóa từ các chiều sau:
Chiến lược giao điểm chéo hai đường đồng đều thừa hưởng các ưu điểm của chiến lược đồng đều, mở rộng việc sử dụng phán đoán hai đường đồng đều và phương thức giao dịch điểm, tạo thành một chương trình giao dịch định lượng đáng tin cậy và tiên tiến hơn. Nó có lợi thế độc đáo về giao dịch thời gian, đáng để kiểm tra thực tế và khám phá ứng dụng. Bài viết này phân tích sâu về nguyên tắc, ưu và nhược điểm của chiến lược và đưa ra các giả định tối ưu hóa để tham khảo.
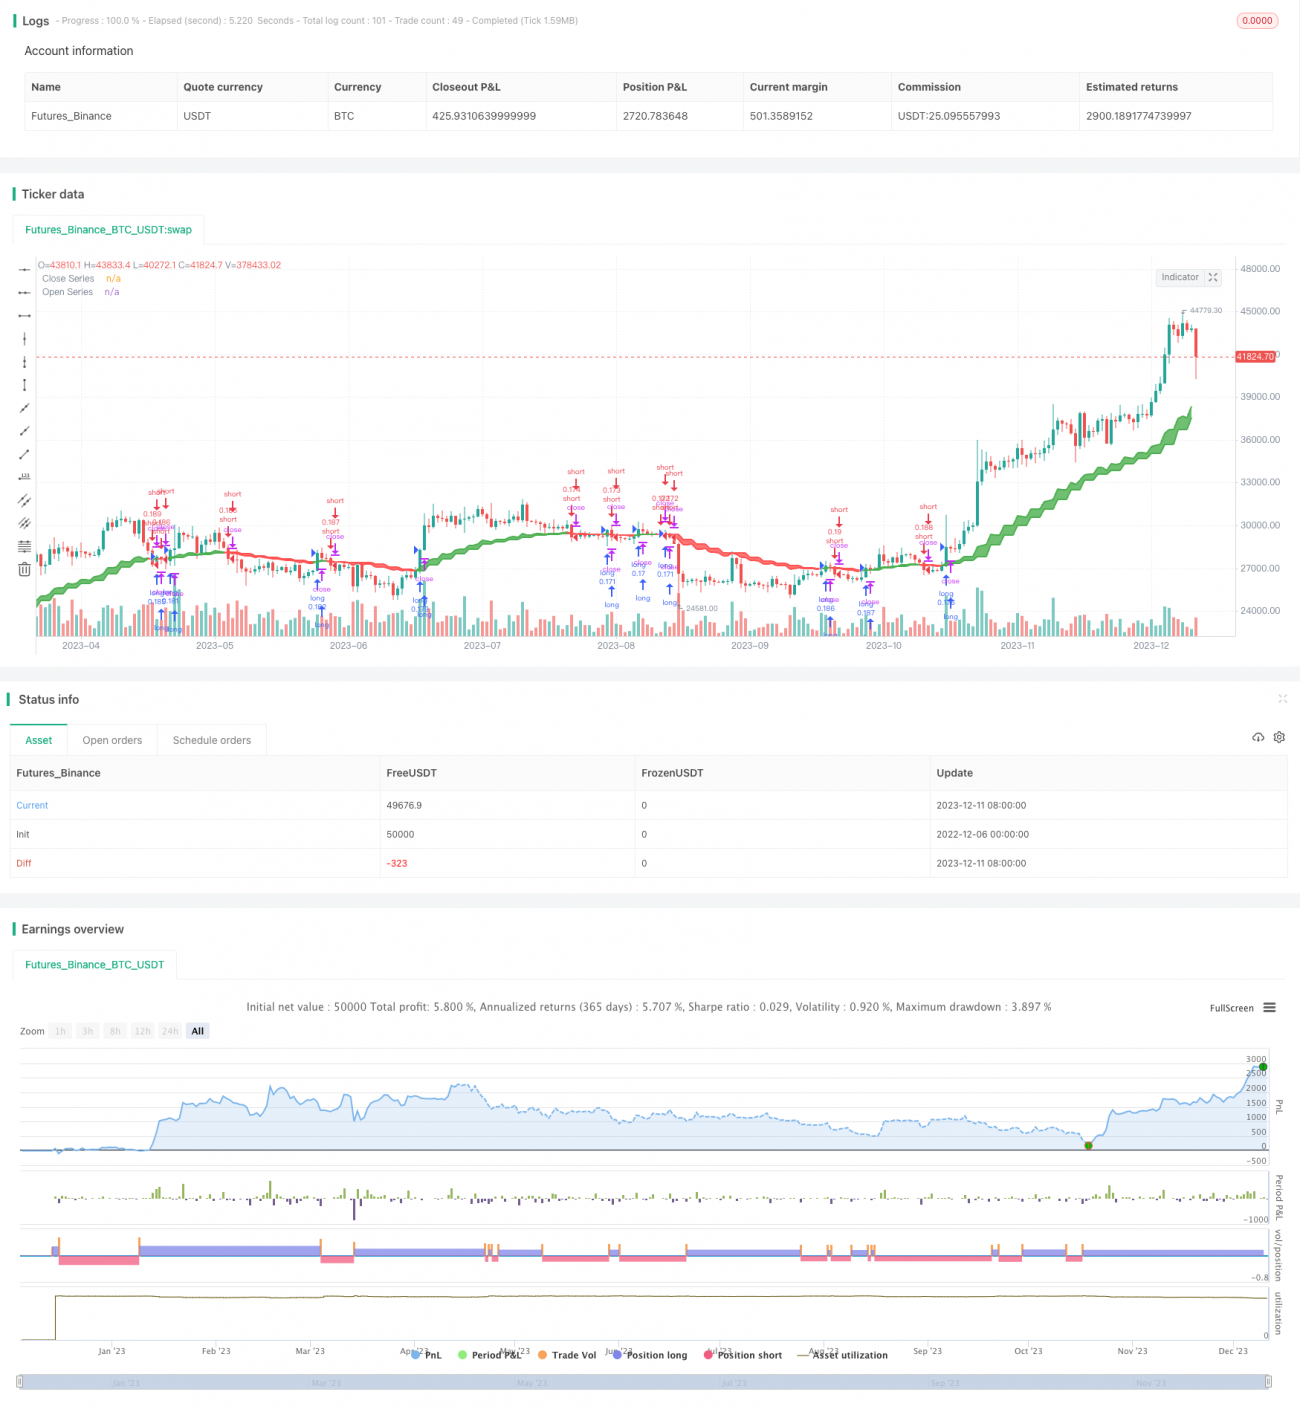
/*backtest
start: 2022-12-06 00:00:00
end: 2023-12-12 00:00:00
period: 1d
basePeriod: 1h
exchanges: [{"eid":"Futures_Binance","currency":"BTC_USDT"}]
*/
//@version=5
//
strategy(title='Open Close Cross Strategy ', shorttitle='sacinvesting', overlay=true, pyramiding=0, default_qty_type=strategy.percent_of_equity, default_qty_value=10, calc_on_every_tick=false)
// === INPUTS ===
useRes = input(defval=true, title='Use Alternate Resolution?')
intRes = input(defval=3, title='Multiplier for Alernate Resolution')
stratRes = timeframe.ismonthly ? str.tostring(timeframe.multiplier * intRes, '###M') : timeframe.isweekly ? str.tostring(timeframe.multiplier * intRes, '###W') : timeframe.isdaily ? str.tostring(timeframe.multiplier * intRes, '###D') : timeframe.isintraday ? str.tostring(timeframe.multiplier * intRes, '####') : '60'
basisType = input.string(defval='SMMA', title='MA Type: ', options=['SMA', 'EMA', 'DEMA', 'TEMA', 'WMA', 'VWMA', 'SMMA', 'HullMA', 'LSMA', 'ALMA', 'SSMA', 'TMA'])
basisLen = input.int(defval=8, title='MA Period', minval=1)
offsetSigma = input.int(defval=6, title='Offset for LSMA / Sigma for ALMA', minval=0)
offsetALMA = input.float(defval=0.85, title='Offset for ALMA', minval=0, step=0.01)
scolor = input(false, title='Show coloured Bars to indicate Trend?')
delayOffset = input.int(defval=0, title='Delay Open/Close MA (Forces Non-Repainting)', minval=0, step=1)
tradeType = input.string('BOTH', title='What trades should be taken : ', options=['LONG', 'SHORT', 'BOTH', 'NONE'])
// === /INPUTS ===
// Constants colours that include fully non-transparent option.
green100 = #008000FF
lime100 = #00FF00FF
red100 = #FF0000FF
blue100 = #0000FFFF
aqua100 = #00FFFFFF
darkred100 = #8B0000FF
gray100 = #808080FF
// === BASE FUNCTIONS ===
// Returns MA input selection variant, default to SMA if blank or typo.
variant(type, src, len, offSig, offALMA) =>
v1 = ta.sma(src, len) // Simple
v2 = ta.ema(src, len) // Exponential
v3 = 2 * v2 - ta.ema(v2, len) // Double Exponential
v4 = 3 * (v2 - ta.ema(v2, len)) + ta.ema(ta.ema(v2, len), len) // Triple Exponential
v5 = ta.wma(src, len) // Weighted
v6 = ta.vwma(src, len) // Volume Weighted
v7 = 0.0
sma_1 = ta.sma(src, len) // Smoothed
v7 := na(v7[1]) ? sma_1 : (v7[1] * (len - 1) + src) / len
v8 = ta.wma(2 * ta.wma(src, len / 2) - ta.wma(src, len), math.round(math.sqrt(len))) // Hull
v9 = ta.linreg(src, len, offSig) // Least Squares
v10 = ta.alma(src, len, offALMA, offSig) // Arnaud Legoux
v11 = ta.sma(v1, len) // Triangular (extreme smooth)
// SuperSmoother filter
// ©️ 2013 John F. Ehlers
a1 = math.exp(-1.414 * 3.14159 / len)
b1 = 2 * a1 * math.cos(1.414 * 3.14159 / len)
c2 = b1
c3 = -a1 * a1
c1 = 1 - c2 - c3
v12 = 0.0
v12 := c1 * (src + nz(src[1])) / 2 + c2 * nz(v12[1]) + c3 * nz(v12[2])
type == 'EMA' ? v2 : type == 'DEMA' ? v3 : type == 'TEMA' ? v4 : type == 'WMA' ? v5 : type == 'VWMA' ? v6 : type == 'SMMA' ? v7 : type == 'HullMA' ? v8 : type == 'LSMA' ? v9 : type == 'ALMA' ? v10 : type == 'TMA' ? v11 : type == 'SSMA' ? v12 : v1
// security wrapper for repeat calls
reso(exp, use, res) =>
security_1 = request.security(syminfo.tickerid, res, exp, gaps=barmerge.gaps_off, lookahead=barmerge.lookahead_on)
use ? security_1 : exp
// === /BASE FUNCTIONS ===
// === SERIES SETUP ===
closeSeries = variant(basisType, close[delayOffset], basisLen, offsetSigma, offsetALMA)
openSeries = variant(basisType, open[delayOffset], basisLen, offsetSigma, offsetALMA)
// === /SERIES ===
// === PLOTTING ===
// Get Alternate resolution Series if selected.
closeSeriesAlt = reso(closeSeries, useRes, stratRes)
openSeriesAlt = reso(openSeries, useRes, stratRes)
//
trendColour = closeSeriesAlt > openSeriesAlt ? color.green : color.red
bcolour = closeSeries > openSeriesAlt ? lime100 : red100
barcolor(scolor ? bcolour : na, title='Bar Colours')
closeP = plot(closeSeriesAlt, title='Close Series', color=trendColour, linewidth=2, style=plot.style_line, transp=20)
openP = plot(openSeriesAlt, title='Open Series', color=trendColour, linewidth=2, style=plot.style_line, transp=20)
fill(closeP, openP, color=trendColour, transp=80)
// === /PLOTTING ===
//
//
// === ALERT conditions
xlong = ta.crossover(closeSeriesAlt, openSeriesAlt)
xshort = ta.crossunder(closeSeriesAlt, openSeriesAlt)
longCond = xlong // alternative: longCond[1]? false : (xlong or xlong[1]) and close>closeSeriesAlt and close>=open
shortCond = xshort // alternative: shortCond[1]? false : (xshort or xshort[1]) and close<closeSeriesAlt and close<=open
// === /ALERT conditions.
// === STRATEGY ===
// stop loss
slPoints = input.int(defval=0, title='Initial Stop Loss Points (zero to disable)', minval=0)
tpPoints = input.int(defval=0, title='Initial Target Profit Points (zero for disable)', minval=0)
// Include bar limiting algorithm
ebar = input.int(defval=10000, title='Number of Bars for Back Testing', minval=0)
dummy = input(false, title='- SET to ZERO for Daily or Longer Timeframes')
//
// Calculate how many mars since last bar
tdays = (timenow - time) / 60000.0 // number of minutes since last bar
tdays := timeframe.ismonthly ? tdays / 1440.0 / 5.0 / 4.3 / timeframe.multiplier : timeframe.isweekly ? tdays / 1440.0 / 5.0 / timeframe.multiplier : timeframe.isdaily ? tdays / 1440.0 / timeframe.multiplier : tdays / timeframe.multiplier // number of bars since last bar
//
//set up exit parameters
TP = tpPoints > 0 ? tpPoints : na
SL = slPoints > 0 ? slPoints : na
// Make sure we are within the bar range, Set up entries and exit conditions
if (ebar == 0 or tdays <= ebar) and tradeType != 'NONE'
strategy.entry('long', strategy.long, when=longCond == true and tradeType != 'SHORT')
strategy.entry('short', strategy.short, when=shortCond == true and tradeType != 'LONG')
strategy.close('long', when=shortCond == true and tradeType == 'LONG')
strategy.close('short', when=longCond == true and tradeType == 'SHORT')
strategy.exit('XL', from_entry='long', profit=TP, loss=SL)
strategy.exit('XS', from_entry='short', profit=TP, loss=SL)
// === /STRATEGY ===
// eof