Chiến lược giao dịch theo xu hướng dựa trên hồi quy tuyến tính và đường trung bình động

Tổng quan
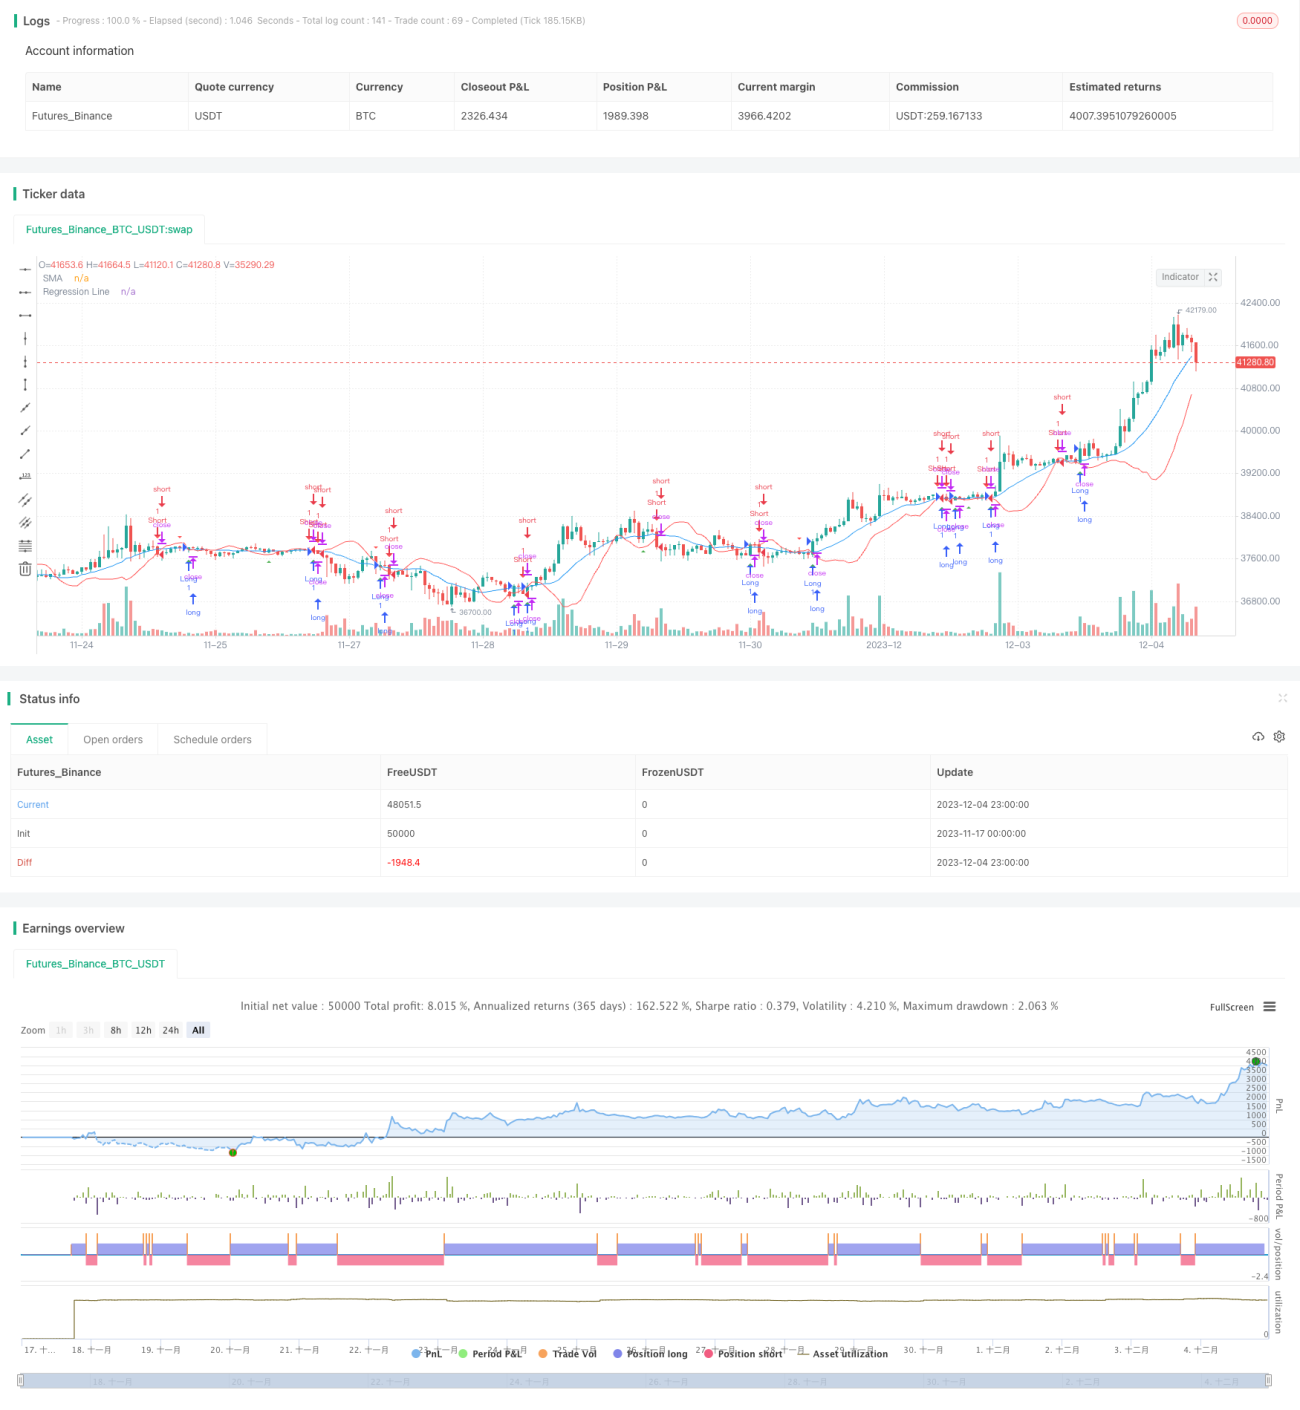
Chiến lược này dựa trên đường hồi quy tuyến tính và đường trung bình di chuyển, thiết kế một hệ thống giao dịch theo dõi xu hướng đơn giản. Khi đường hồi quy tuyến tính đi qua đường trung bình di chuyển, hãy làm nhiều và khi đường hồi quy tuyến tính đi qua đường trung bình di chuyển, hãy làm trống.
Tên chiến lược
Trend Following Regression Trading Strategy (Chiến lược giao dịch theo hồi quy xu hướng)
Nguyên tắc chiến lược
Chiến lược này bao gồm các phần quan trọng sau:
- Tính trung bình di chuyển đơn giản (SMA) trong n ngày
- Tính toán đường hồi quy tuyến tính gần nhất của ngày N
- Làm nhiều hơn khi giá đóng cửa vượt qua đường SMA và cao hơn đường hồi phục
- Khi giá đóng cửa vượt qua đường SMA và dưới đường hồi phục, hãy tháo lỗ
- Thiết lập giá dừng lỗ và giá dừng bán
Đường co lại tuyến tính phù hợp với hướng xu hướng trong một khoảng thời gian gần đây. Điều này có thể được sử dụng để xác định hướng của xu hướng tổng thể. Khi giá phá vỡ đường SMA, chúng tôi cần phải đánh giá thêm về hướng của đường co lại tuyến tính có phù hợp với sự phá vỡ này hay không. Chỉ khi hai hướng này phù hợp, tín hiệu giao dịch sẽ được tạo ra.
Ngoài ra, chiến lược này cũng đặt một cơ chế dừng lỗ. Khi giá chạm vào đường dừng lỗ, lệnh dừng lỗ sẽ được thực hiện. Cũng có một đường dừng, khóa một phần lợi nhuận.
Lợi thế chiến lược
Chiến lược này có những ưu điểm sau:
- Kết hợp các chỉ số xu hướng và các chỉ số đột phá, tránh đột phá giả, cải thiện chất lượng tín hiệu
- Sử dụng hồi quy tuyến tính để xác định hướng xu hướng, lọc xu hướng, chỉ làm nhiều khi xu hướng tăng, làm trống khi xu hướng giảm
- Thiết lập các cơ chế dừng và dừng để kiểm soát rủi ro
- Quy tắc rõ ràng, dễ hiểu và dễ thực hiện
- Chỉ cần điều chỉnh một vài tham số, không cần quá phức tạp
Phân tích rủi ro
Chiến lược này cũng có một số rủi ro:
- Các tín hiệu giao dịch sai sẽ được tạo ra nhiều hơn trong các biến động.
- Thiết lập đường trung bình di chuyển và chu kỳ hồi phục cần được kiểm tra và tối ưu hóa nhiều lần, thiết lập sai có thể ảnh hưởng đến hiệu suất của chiến lược
- Hạn chế thiệt hại trong trường hợp cực đoan có thể gây ra thiệt hại lớn hơn khi phá vỡ
- Dựa trên chỉ số kỹ thuật, không kết hợp các yếu tố cơ bản
Chúng ta có thể tối ưu hóa đối với những rủi ro này bằng cách:
- Trong thị trường bất ổn, hãy cân nhắc các chiến lược tạm dừng hoặc sử dụng các chỉ số khác để lọc
- Các tham số được thử nghiệm lặp đi lặp lại để tìm các tham số tối ưu
- Tối ưu hóa và động điều chỉnh vị trí dừng lỗ
- Kết hợp các yếu tố cơ bản như dữ liệu kinh tế
Hướng tối ưu hóa
Chiến lược này có thể được tối ưu hóa bằng cách:
- Thêm các chỉ số hỗ trợ khác để đánh giá tình trạng thị trường, tránh giao dịch trong tình trạng chấn động
- Tối ưu hóa các loại trung bình di chuyển, chẳng hạn như kết hợp trung bình di chuyển đôi, trung bình di chuyển ba
- Phân tích sâu hơn về độ lệch đường hồi quy, thêm quy tắc phán đoán độ lệch
- Kết hợp với chỉ số dao động, thiết lập vị trí dừng lỗ động
- Sử dụng phương pháp học máy để tự động tối ưu hóa các tham số
Tóm tắt
Chiến lược này kết hợp các tính năng theo dõi xu hướng của trung bình di chuyển với các tính năng phán đoán xu hướng của sự hồi phục tuyến tính, tạo thành một hệ thống giao dịch theo dõi xu hướng tương đối đơn giản và dễ dàng. Trong thị trường có xu hướng rõ ràng, chiến lược này có thể có hiệu quả tốt hơn.
- 1