
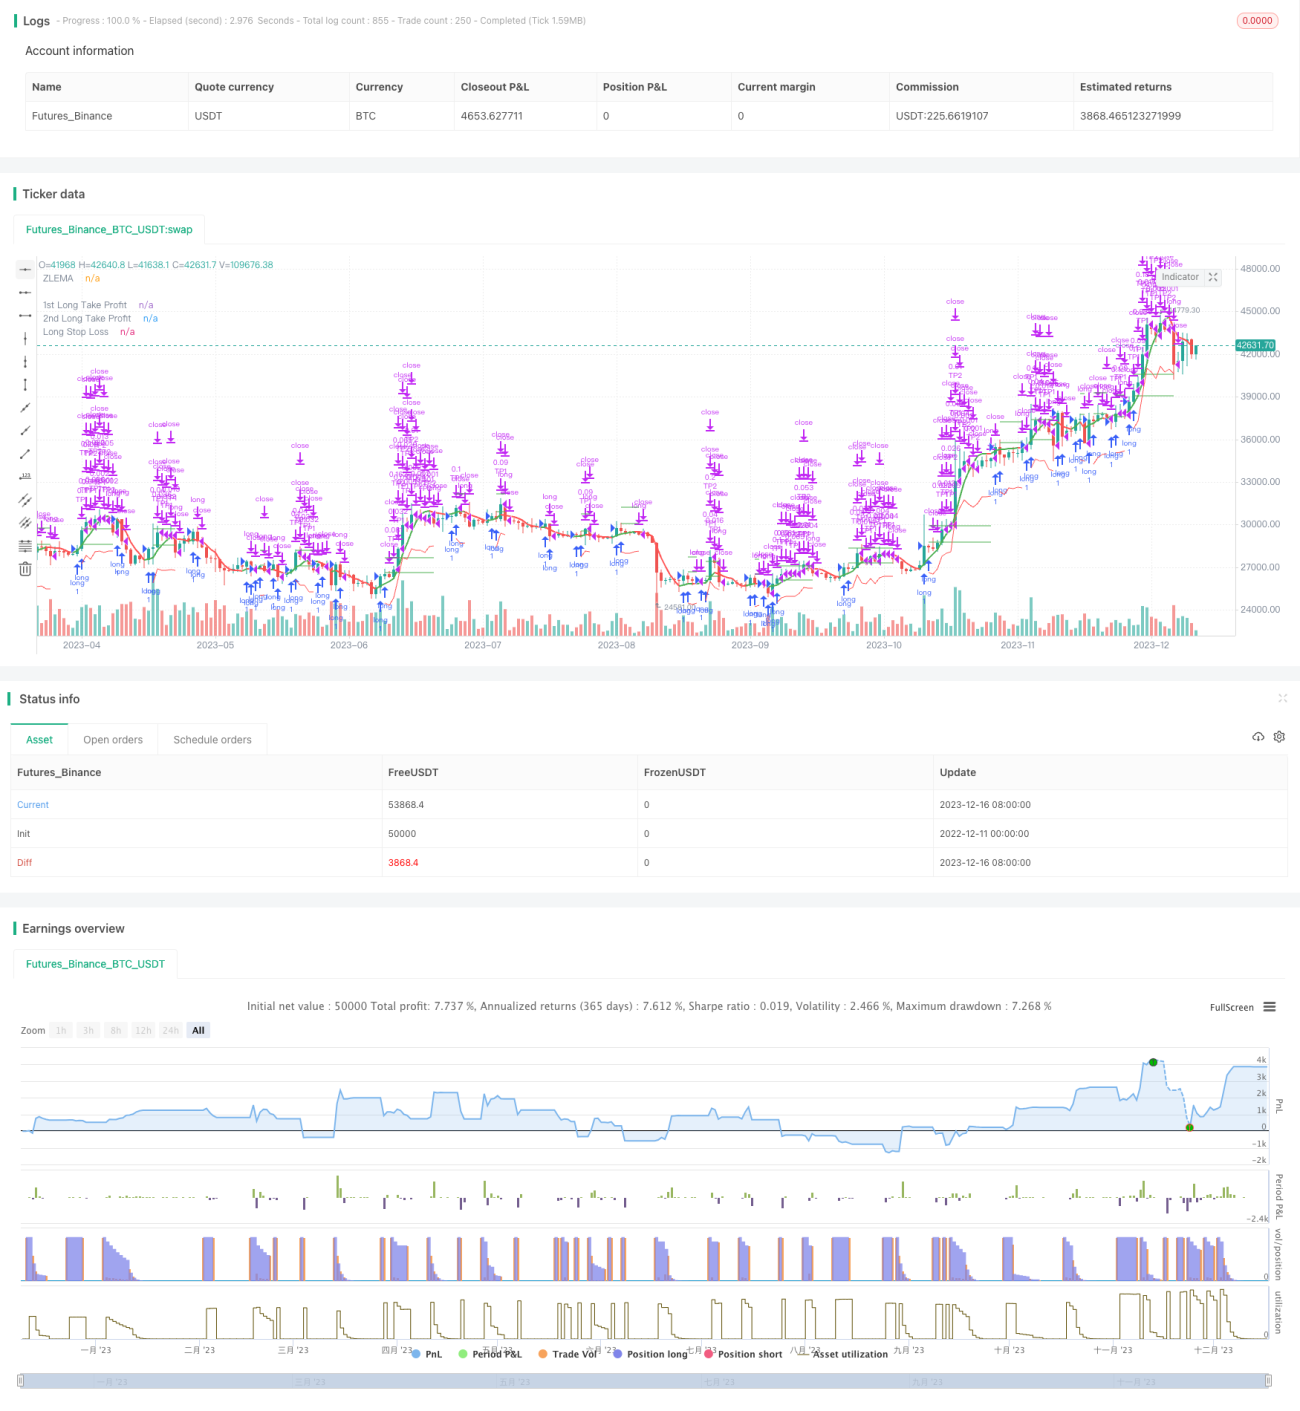
Chiến lược này là một chiến lược giữ vị trí đơn giản dựa trên đường SMA trung bình. Khi đường SMA ngắn hạn đi qua đường SMA dài, hãy mở thêm vị trí; Khi đường SMA ngắn hạn đi qua đường SMA dài, hãy giữ vị trí thấp.
Chiến lược này sử dụng hai đường trung bình SMA, một đường ngắn hạn 20 ngày và một đường dài 50 ngày. Đường ngắn hạn có thể nắm bắt xu hướng thay đổi giá nhanh hơn, đường dài lọc tiếng ồn ngắn hạn.
Nhìn chung, chiến lược này sử dụng các đặc điểm đường cong của đường SMA để đánh giá xu hướng chuyển động giá trên hai chiều thời gian và lợi nhuận bằng cách giữ một vị trí ổn định hơn.
Chiến lược này có những ưu điểm sau:
Chiến lược này cũng có những rủi ro sau:
Chiến lược này cũng có thể được tối ưu hóa theo các khía cạnh sau:
Nhìn chung, chiến lược giữ vị trí SMA trung bình ổn định, đơn giản, dễ sử dụng và phù hợp cho người mới bắt đầu. Với sự phát triển của giao dịch định lượng, chiến lược này có thể giới thiệu nhiều chỉ số và phương tiện kỹ thuật để tối ưu hóa để có hiệu quả tốt hơn.
/*backtest
start: 2022-12-11 00:00:00
end: 2023-12-17 00:00:00
period: 1d
basePeriod: 1h
exchanges: [{"eid":"Futures_Binance","currency":"BTC_USDT"}]
*/
//@version=5
strategy('Zlema Strateg Long 5m', overlay=true )
// FUNCTIONS
Atr(p) =>
atr = 0.
Tr = math.max(high - low, math.max(math.abs(high - close[1]), math.abs(low - close[1])))
atr := nz(atr[1] + (Tr - atr[1]) / p, Tr)
atr
// ZLEMA
length = input(title='Length', defval=14)
highlightMovements = input(title='Highlight Movements ?', defval=true)
src = input(title='Source', defval=close)
lag = math.floor((length - 1) / 2)
zlema = ta.ema(src + src - src[lag], length)
zlemaColor = highlightMovements ? zlema > zlema[1] ? color.green : color.red : #6d1e7f
plot(zlema, title='ZLEMA', linewidth=2, color=zlemaColor, transp=0)
// TAKE PROFIT AND STOP LOSS
long_tp1_inp = input.float(1, title='Long Take Profit 1 %', step=0.1) / 100
long_tp1_qty = input.int(10, title='Long Take Profit 1 Qty', step=1)
long_tp2_inp = input.float(5, title='Long Take Profit 2%', step=0.1) / 100
long_tp2_qty = input.int(50, title='Long Take Profit 2 Qty', step=1)
long_take_level_1 = strategy.position_avg_price * (1 + long_tp1_inp)
long_take_level_2 = strategy.position_avg_price * (1 + long_tp2_inp)
// Stop Loss
multiplier = input.float(2.2, 'SL Mutiplier', minval=1, step=0.1)
ATR_period = input.int(17, 'ATR period', minval=1, step=1)
// Strategy
entry_long = zlema > zlema[1]
entry_price_long = ta.valuewhen(entry_long, close, 0)
SL_floating_long = entry_price_long - multiplier * Atr(ATR_period)
exit_long = zlema < zlema[1]
///// BACKTEST PERIOD ///////
testStartYear = input(2022, 'Backtest Start Year')
testStartMonth = input(1, 'Backtest Start Month')
testStartDay = input(1, 'Backtest Start Day')
testPeriodStart = timestamp(testStartYear, testStartMonth, testStartDay, 0, 0)
testStopYear = input(9999, 'Backtest Stop Year')
testStopMonth = input(12, 'Backtest Stop Month')
testStopDay = input(31, 'Backtest Stop Day')
testPeriodStop = timestamp(testStopYear, testStopMonth, testStopDay, 0, 0)
testPeriod() =>
time >= testPeriodStart and time <= testPeriodStop ? true : false
if testPeriod()
strategy.entry('long', strategy.long, comment='Long', when=entry_long)
strategy.exit('TP1', 'long', qty_percent=long_tp1_qty, limit=long_take_level_1) //, trail_points=entry_price_long * long_trailing / syminfo.mintick, trail_offset=entry_price_long * long_trailing / syminfo.mintick)
strategy.exit('TP2', qty_percent=long_tp2_qty, limit=long_take_level_2) //, trail_points=entry_price_long * long_trailing / syminfo.mintick, trail_offset=entry_price_long * long_trailing / syminfo.mintick)
strategy.close('long', when=exit_long, comment='exit long')
// LONG POSITION
plot(strategy.position_size > 0 ? long_take_level_1 : na, style=plot.style_linebr, color=color.new(color.green, 0), linewidth=1, title='1st Long Take Profit')
plot(strategy.position_size > 0 ? long_take_level_2 : na, style=plot.style_linebr, color=color.new(color.green, 0), linewidth=1, title='2nd Long Take Profit')
plot(strategy.position_size > 0 ? SL_floating_long : na, style=plot.style_linebr, color=color.new(color.red, 0), linewidth=1, title='Long Stop Loss')
if testPeriod()
strategy.entry('long', strategy.long, comment='Long', when=entry_long)
// LONG POSITIONplot(strategy.position_size > 0 ? SL_floating_long : na, style=plot.style_linebr, color=color.new(color.red, 0), linewidth=1, title='Long Stop Loss')